
I've seen many questions regarding the AUROC metric used within this competition. I posted this explanation as a comment, but I'd like to make a dedicated topic with an intuitive explanation. Especially because googling the metric can give you mathematical formulas which are far from easy to interpret.
\n\n1)\nAn easy interpretation is the following: \"if I would take 1 positive sample and 1 negative sample, what is the probability that our model assigned a higher score to the positive sample\".
\n\nThe important detail here is, is that the only thing that matters is that the positive samples get higher scores. How high these scores or how much higher these scores are, is irrelevant to AUC.
\n\n2)\nAnother way of looking at AUC is that it measures the degree of separation between predictions of positive samples and negative samples.
\n\nIf you plot a histogram of negative samples and a histogram of positive samples, then you want the histogram of the positive to be to the right of the negative. If there is no overlap between the histograms, then your AUC is 1.0
\n\nHere's an image to make this more clear: assume that the red are predictions of positive samples and blue predictions of negative samples. 1-AUC corresponds to the amount of overlap between these two histograms/kde
\n\n
Again, important to note here is that the values on the x-axis do not matter (it could be in the millions). It merely measures the separation.
", "messages": [ { "id": "961773", "postDate": "08/07/2020 13:40:43", "content": "I've seen many questions regarding the AUROC metric used within this competition. I posted this explanation as a comment, but I'd like to make a dedicated topic with an intuitive explanation. Especially because googling the metric can give you mathematical formulas which are far from easy to interpret.
\n\n1)\nAn easy interpretation is the following: \"if I would take 1 positive sample and 1 negative sample, what is the probability that our model assigned a higher score to the positive sample\".
\n\nThe important detail here is, is that the only thing that matters is that the positive samples get higher scores. How high these scores or how much higher these scores are, is irrelevant to AUC.
\n\n2)\nAnother way of looking at AUC is that it measures the degree of separation between predictions of positive samples and negative samples.
\n\nIf you plot a histogram of negative samples and a histogram of positive samples, then you want the histogram of the positive to be to the right of the negative. If there is no overlap between the histograms, then your AUC is 1.0
\n\nHere's an image to make this more clear: assume that the red are predictions of positive samples and blue predictions of negative samples. 1-AUC corresponds to the amount of overlap between these two histograms/kde
\n\n
Again, important to note here is that the values on the x-axis do not matter (it could be in the millions). It merely measures the separation.
", "rawMarkdown": "I've seen many questions regarding the AUROC metric used within this competition. I posted this explanation as a comment, but I'd like to make a dedicated topic with an intuitive explanation. Especially because googling the metric can give you mathematical formulas which are far from easy to interpret.\n\n1)\nAn easy interpretation is the following: \"if I would take 1 positive sample and 1 negative sample, what is the probability that our model assigned a higher score to the positive sample\".\n\nThe important detail here is, is that the only thing that matters is that the positive samples get higher scores. How high these scores or how much higher these scores are, is irrelevant to AUC.\n\n2)\nAnother way of looking at AUC is that it measures the degree of separation between predictions of positive samples and negative samples.\n\nIf you plot a histogram of negative samples and a histogram of positive samples, then you want the histogram of the positive to be to the right of the negative. If there is no overlap between the histograms, then your AUC is 1.0\n\nHere's an image to make this more clear: assume that the red are predictions of positive samples and blue predictions of negative samples. 1-AUC corresponds to the amount of overlap between these two histograms/kde\n\n\n\nAgain, important to note here is that the values on the x-axis do not matter (it could be in the millions). It merely measures the separation.", "votes": null }, { "id": "961781", "postDate": "08/07/2020 13:50:09", "content": "thanks @group16 for info
", "rawMarkdown": "thanks @group16 for info", "votes": null }, { "id": "961799", "postDate": "08/07/2020 14:11:02", "content": "Most welcome!
", "rawMarkdown": "Most welcome!", "votes": null }, { "id": "961836", "postDate": "08/07/2020 14:47:40", "content": "Nice and simple, thanks for sharing!
", "rawMarkdown": "Nice and simple, thanks for sharing!", "votes": null }, { "id": "961867", "postDate": "08/07/2020 15:13:58", "content": "Thanks this is a nice intuitive explanation. Here's an animated plot from here showing how each vertical line on the histogram plot (a choosen threshold) corresponds to one point on the ROC (with associated TPR, FPR).
\n
Thanks Chris! This is a very clear visual example of how the AUC (albeit an approximation) is actually calculated!
", "rawMarkdown": "Thanks Chris! This is a very clear visual example of how the AUC (albeit an approximation) is actually calculated!", "votes": null }, { "id": "961925", "postDate": "08/07/2020 16:08:33", "content": "Yes. I have been planning on making a post about AUC for months now. There are other cool things that people don't realize about AUC. I want to show how you can calculate AUC (for small datasets) by hand via drawing a picture and not using a calculator.
\nHaving a good understanding about AUC, allows us to increase our model's AUC. It also allows us to extract information from test data via LB probing. For example Sirish, determined the number of malignant in public test via one LB probe. There are other ways to probe LB AUC.
", "rawMarkdown": "Yes. I have been planning on making a post about AUC for months now. There are other cool things that people don't realize about AUC. I want to show how you can calculate AUC (for small datasets) by hand via drawing a picture and not using a calculator. \n\nHaving a good understanding about AUC, allows us to increase our model's AUC. It also allows us to extract information from test data via LB probing. For example Sirish, determined the number of malignant in public test via one LB probe. There are other ways to probe LB AUC.", "votes": null }, { "id": "961929", "postDate": "08/07/2020 16:14:40", "content": "Most definitely! It is a very intriguing metric :)
", "rawMarkdown": "Most definitely! It is a very intriguing metric :)", "votes": null }, { "id": "962362", "postDate": "08/08/2020 04:51:00", "content": "Great explanation, thanks! :)
", "rawMarkdown": "Great explanation, thanks! :)", "votes": null }, { "id": "962445", "postDate": "08/08/2020 06:12:51", "content": "@group16 @cdeotte Thanks again for your sharing! 🙏
", "rawMarkdown": "group16 @cdeotte Thanks again for your sharing! 🙏", "votes": null }, { "id": "962521", "postDate": "08/08/2020 07:37:46", "content": "nice and simple
", "rawMarkdown": "nice and simple", "votes": null }, { "id": "964608", "postDate": "08/10/2020 03:37:10", "content": "nice thx!
", "rawMarkdown": "nice thx!", "votes": null }, { "id": "964826", "postDate": "08/10/2020 07:49:04", "content": "Nice points - thanks!
\n\nI only relatively recently learned that the AUC is the chance that a randomly sampled positive sample is ranked higher by our classifier than a randomly chosen negative sample. Before that I always struggled to explain the AUC and that additional intuition is great when trying to understand how 'good' a classifier is.
", "rawMarkdown": "Nice points - thanks!\n\nI only relatively recently learned that the AUC is the chance that a randomly sampled positive sample is ranked higher by our classifier than a randomly chosen negative sample. Before that I always struggled to explain the AUC and that additional intuition is great when trying to understand how 'good' a classifier is.", "votes": null }, { "id": "965195", "postDate": "08/10/2020 13:04:17", "content": "Thanks @group16 for this.
", "rawMarkdown": "Thanks @group16 for this.", "votes": null }, { "id": "965196", "postDate": "08/10/2020 13:05:45", "content": "Thanks @cdeotte very clear.
", "rawMarkdown": "Thanks @cdeotte very clear.", "votes": null }, { "id": "965592", "postDate": "08/10/2020 18:13:03", "content": "This is a gem.Thanks!
", "rawMarkdown": "This is a gem.Thanks!", "votes": null }, { "id": "972564", "postDate": "08/16/2020 16:34:05", "content": "Thanks Gilles and Chris, it's a great way to visualize the AOC.
\nIt's facinating that when ROC=0, the model is reciprocating the result, so predicting 0s as 1s and 1s as 0s.
\nWhen ROC=0.5 the model's prediction is completely random.
thanks @group16 for info
", "votes": null, "replies": [ { "id": 961799, "author_name": "group16", "author_url": "", "post_date": "08/07/2020 14:11:02", "content": "Most welcome!
", "votes": null, "replies": [] } ] }, { "id": 961836, "author_name": "datafan07", "author_url": "", "post_date": "08/07/2020 14:47:40", "content": "Nice and simple, thanks for sharing!
", "votes": null, "replies": [] }, { "id": 961867, "author_name": "cdeotte", "author_url": "", "post_date": "08/07/2020 15:13:58", "content": "Thanks this is a nice intuitive explanation. Here's an animated plot from here showing how each vertical line on the histogram plot (a choosen threshold) corresponds to one point on the ROC (with associated TPR, FPR).
\n
Thanks Chris! This is a very clear visual example of how the AUC (albeit an approximation) is actually calculated!
", "votes": null, "replies": [] }, { "id": 961925, "author_name": "cdeotte", "author_url": "", "post_date": "08/07/2020 16:08:33", "content": "Yes. I have been planning on making a post about AUC for months now. There are other cool things that people don't realize about AUC. I want to show how you can calculate AUC (for small datasets) by hand via drawing a picture and not using a calculator.
\nHaving a good understanding about AUC, allows us to increase our model's AUC. It also allows us to extract information from test data via LB probing. For example Sirish, determined the number of malignant in public test via one LB probe. There are other ways to probe LB AUC.
", "votes": null, "replies": [] }, { "id": 961929, "author_name": "group16", "author_url": "", "post_date": "08/07/2020 16:14:40", "content": "Most definitely! It is a very intriguing metric :)
", "votes": null, "replies": [] }, { "id": 965196, "author_name": "andersericssongnosco", "author_url": "", "post_date": "08/10/2020 13:05:45", "content": "Thanks @cdeotte very clear.
", "votes": null, "replies": [] } ] }, { "id": 962445, "author_name": "fiyeroleung", "author_url": "", "post_date": "08/08/2020 06:12:51", "content": "@group16 @cdeotte Thanks again for your sharing! 🙏
", "votes": null, "replies": [] }, { "id": 972564, "author_name": "jsarmo", "author_url": "", "post_date": "08/16/2020 16:34:05", "content": "Thanks Gilles and Chris, it's a great way to visualize the AOC.
\nIt's facinating that when ROC=0, the model is reciprocating the result, so predicting 0s as 1s and 1s as 0s.
\nWhen ROC=0.5 the model's prediction is completely random.
Great explanation, thanks! :)
", "votes": null, "replies": [] }, { "id": 962521, "author_name": "vikrantkc", "author_url": "", "post_date": "08/08/2020 07:37:46", "content": "nice and simple
", "votes": null, "replies": [] }, { "id": 964608, "author_name": "fantasticbobo", "author_url": "", "post_date": "08/10/2020 03:37:10", "content": "nice thx!
", "votes": null, "replies": [] }, { "id": 964826, "author_name": "fchmiel", "author_url": "", "post_date": "08/10/2020 07:49:04", "content": "Nice points - thanks!
\n\nI only relatively recently learned that the AUC is the chance that a randomly sampled positive sample is ranked higher by our classifier than a randomly chosen negative sample. Before that I always struggled to explain the AUC and that additional intuition is great when trying to understand how 'good' a classifier is.
", "votes": null, "replies": [] }, { "id": 965195, "author_name": "andersericssongnosco", "author_url": "", "post_date": "08/10/2020 13:04:17", "content": "Thanks @group16 for this.
", "votes": null, "replies": [] }, { "id": 965592, "author_name": "sagnikpatra", "author_url": "", "post_date": "08/10/2020 18:13:03", "content": "This is a gem.Thanks!
", "votes": null, "replies": [] } ], "raw_markdown_by_id": { "961773": "I've seen many questions regarding the AUROC metric used within this competition. I posted this explanation as a comment, but I'd like to make a dedicated topic with an intuitive explanation. Especially because googling the metric can give you mathematical formulas which are far from easy to interpret.\n\n1)\nAn easy interpretation is the following: \"if I would take 1 positive sample and 1 negative sample, what is the probability that our model assigned a higher score to the positive sample\".\n\nThe important detail here is, is that the only thing that matters is that the positive samples get higher scores. How high these scores or how much higher these scores are, is irrelevant to AUC.\n\n2)\nAnother way of looking at AUC is that it measures the degree of separation between predictions of positive samples and negative samples.\n\nIf you plot a histogram of negative samples and a histogram of positive samples, then you want the histogram of the positive to be to the right of the negative. If there is no overlap between the histograms, then your AUC is 1.0\n\nHere's an image to make this more clear: assume that the red are predictions of positive samples and blue predictions of negative samples. 1-AUC corresponds to the amount of overlap between these two histograms/kde\n\n\n\nAgain, important to note here is that the values on the x-axis do not matter (it could be in the millions). It merely measures the separation.", "961781": "thanks @group16 for info", "961799": "Most welcome!", "961836": "Nice and simple, thanks for sharing!", "961867": "Thanks this is a nice intuitive explanation. Here's an animated plot from [here][1] showing how each vertical line on the histogram plot (a choosen threshold) corresponds to one point on the ROC (with associated TPR, FPR).\n \n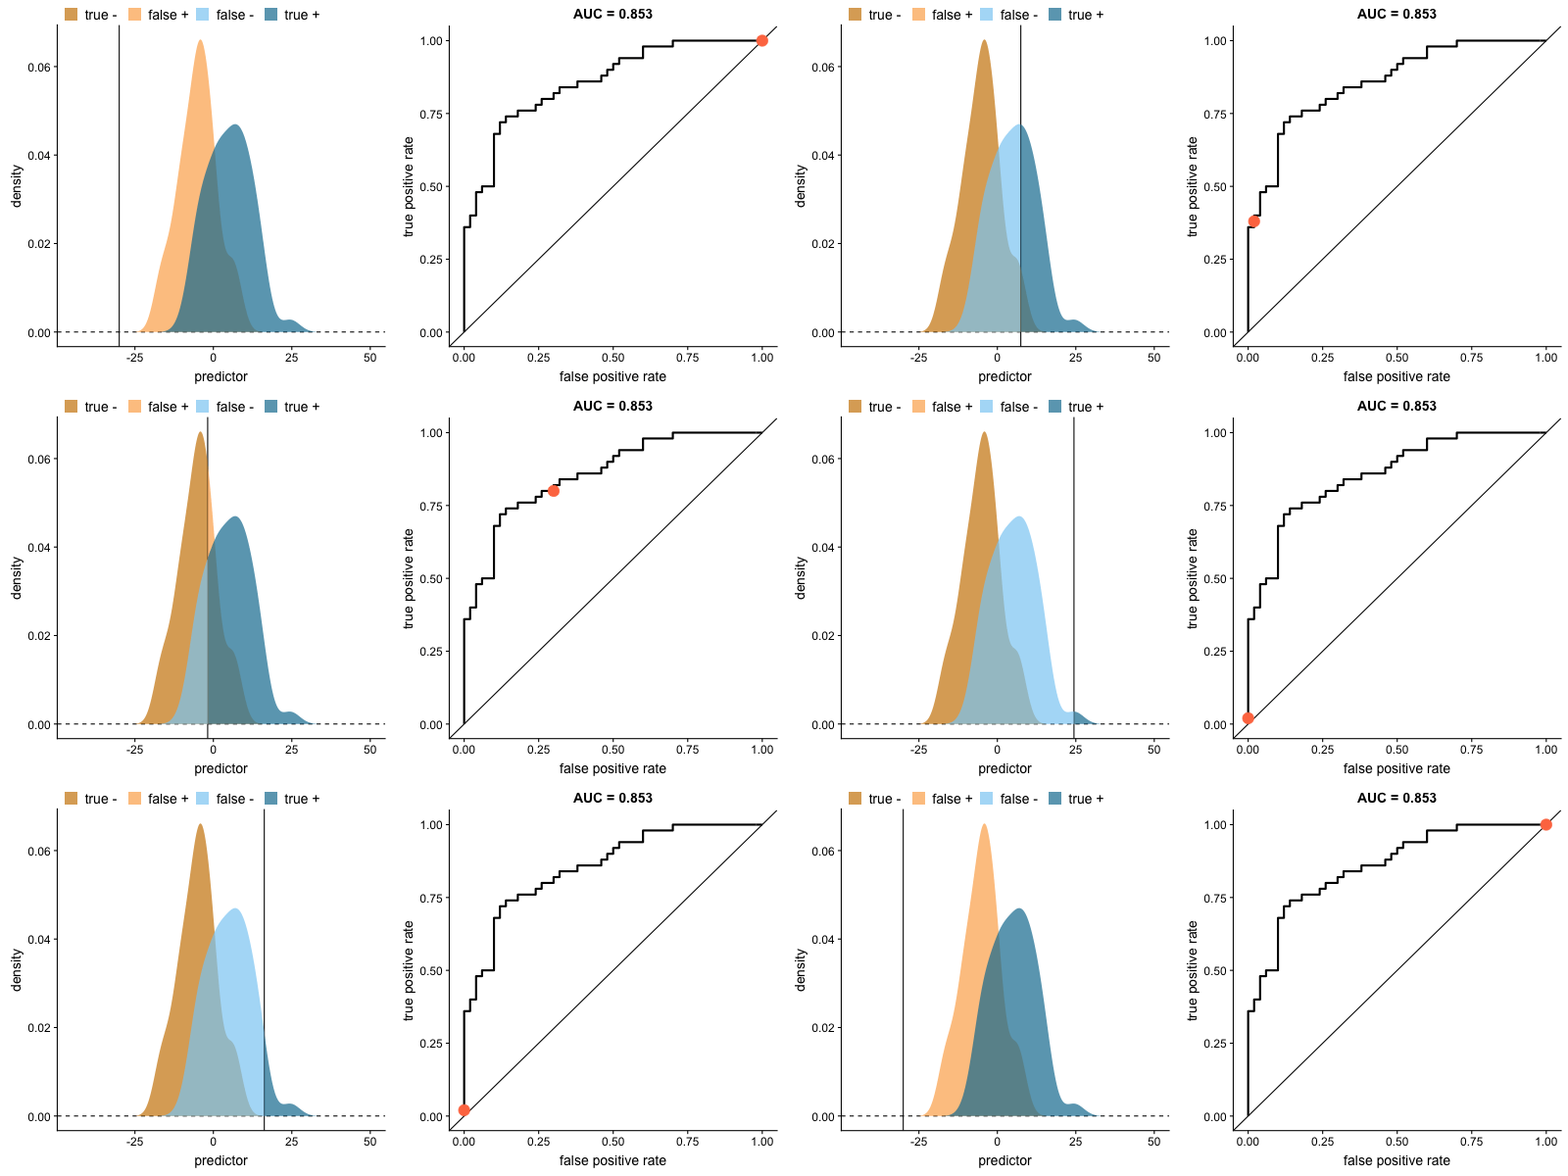\n\n[1]: https://www.jeremyjordan.me/imbalanced-data/", "961874": "Thanks Chris! This is a very clear visual example of how the AUC (albeit an approximation) is actually calculated!", "961925": "Yes. I have been planning on making a post about AUC for months now. There are other cool things that people don't realize about AUC. I want to show how you can calculate AUC (for small datasets) by hand via drawing a picture and not using a calculator. \n\nHaving a good understanding about AUC, allows us to increase our model's AUC. It also allows us to extract information from test data via LB probing. For example Sirish, determined the number of malignant in public test via one LB probe. There are other ways to probe LB AUC.", "961929": "Most definitely! It is a very intriguing metric :)", "962362": "Great explanation, thanks! :)", "962445": "group16 @cdeotte Thanks again for your sharing! 🙏", "962521": "nice and simple", "964608": "nice thx!", "964826": "Nice points - thanks!\n\nI only relatively recently learned that the AUC is the chance that a randomly sampled positive sample is ranked higher by our classifier than a randomly chosen negative sample. Before that I always struggled to explain the AUC and that additional intuition is great when trying to understand how 'good' a classifier is.", "965195": "Thanks @group16 for this.", "965196": "Thanks @cdeotte very clear.", "965592": "This is a gem.Thanks!", "972564": "Thanks Gilles and Chris, it's a great way to visualize the AOC. \nIt's facinating that when ROC=0, the model is reciprocating the result, so predicting 0s as 1s and 1s as 0s. \nWhen ROC=0.5 the model's prediction is completely random." }, "source": "meta" }