{"cells":[{"metadata":{},"cell_type":"markdown","source":"## [SIIM-ISIC Melanoma Classification](https://www.kaggle.com/c/siim-isic-melanoma-classification/)\n\n\n","execution_count":null},{"metadata":{},"cell_type":"markdown","source":"### About Melanoma\n\nThe most serious type of **skin cancer**. \n**Melanoma** occurs when the pigment-producing cells that give colour to the skin become cancerous. \n**Symptoms** might include a new, unusual growth or a change in an existing mole. Melanomas can occur anywhere on the body. \n**Treatment** may involve surgery, radiation, medication or in some cases, chemotherapy.\n\n\n---\n\n\n### Objetive\n\nIn this competition, you’ll identify melanoma in images of skin lesions. In particular, you’ll use images within the same patient and determine which are likely to represent a melanoma. Using patient-level contextual information may help the development of image analysis tools, which could better support clinical dermatologists.\n\nMelanoma is a deadly disease, but if caught early, most melanomas can be cured with minor surgery. Image analysis tools that automate the diagnosis of melanoma will improve dermatologists' diagnostic accuracy. Better detection of melanoma has the opportunity to positively impact millions of people.\n\n\n---\n\n\n### Dataset\n\nThe images are provided in DICOM format. This can be accessed using commonly-available libraries like pydicom, and contains both image and metadata. It is a commonly used medical imaging data format.\n\nImages are also provided in JPEG and TFRecord format (in the jpeg and tfrecords directories, respectively). Images in TFRecord format have been resized to a uniform 1024x1024.\n\nMetadata is also provided outside of the DICOM format, in CSV files. See the Columns section for a description.\n\n\n---\n\n\n### Evaluation Metric: ROC-AUC\n\n**What is AUC - ROC Curve?**\n\nAUC - ROC curve is a performance measurement for classification problem at various thresholds settings. ROC is a probability curve and AUC represents degree or measure of separability. It tells how much model is capable of distinguishing between classes. Higher the AUC, better the model is at predicting 0s as 0s and 1s as 1s. By analogy, Higher the AUC, better the model is at distinguishing between patients with disease and no disease. \n\nThe ROC curve is plotted with TPR against the FPR where TPR is on y-axis and FPR is on the x-axis.\n\n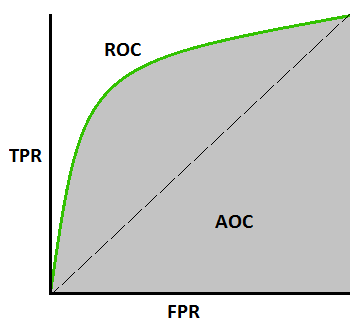\nsource: [https://towardsdatascience.com/understanding-auc-roc-curve-68b2303cc9c5](https://towardsdatascience.com/understanding-auc-roc-curve-68b2303cc9c5)\n\nHere is the link to a great [video](https://youtu.be/4jRBRDbJemM) on **roc-auc**\n\n---\n\n Please!!! Upvote this kernel if you find it useful. ","execution_count":null},{"metadata":{},"cell_type":"markdown","source":"## 1. Importing necessary libraries","execution_count":null},{"metadata":{"_uuid":"8f2839f25d086af736a60e9eeb907d3b93b6e0e5","_cell_guid":"b1076dfc-b9ad-4769-8c92-a6c4dae69d19","trusted":true},"cell_type":"code","source":"import pandas as pd\nimport numpy as np\nimport os\nimport cv2\nfrom collections import Counter, defaultdict\nimport random\nfrom datetime import date\n\nimport matplotlib.pyplot as plt\nimport seaborn as sns\nimport plotly.graph_objects as go\nimport plotly.express as px\nfrom plotly.subplots import make_subplots\nimport plotly.figure_factory as ff\n\nfrom kaggle_datasets import KaggleDatasets\n\nimport tensorflow as tf\nfrom sklearn.linear_model import LogisticRegression\nfrom sklearn.ensemble import RandomForestClassifier\nfrom sklearn.metrics import roc_auc_score, classification_report\nfrom sklearn.preprocessing import StandardScaler, LabelEncoder\n\nSEED = 2020\nrandom.seed(SEED)\nnp.random.seed(SEED)\ntf.random.set_seed(SEED)\nos.environ['PYTHONHASHSEED'] = str(SEED)\n\n# from IPython.core.interactiveshell import InteractiveShell\n# InteractiveShell.ast_node_interactivity = \"all\"","execution_count":null,"outputs":[]},{"metadata":{},"cell_type":"markdown","source":"## 2. Loading Dataset","execution_count":null},{"metadata":{"trusted":true},"cell_type":"code","source":"DATA_PATH = '/kaggle/input/siim-isic-melanoma-classification/'\nos.listdir(DATA_PATH)","execution_count":null,"outputs":[]},{"metadata":{"trusted":true},"cell_type":"code","source":"trainMeta = pd.read_csv(DATA_PATH + 'train.csv')\ntestMeta = pd.read_csv(DATA_PATH + 'test.csv')\nsampleSubmission = pd.read_csv(DATA_PATH + 'sample_submission.csv')","execution_count":null,"outputs":[]},{"metadata":{},"cell_type":"markdown","source":"## 3. EDA","execution_count":null},{"metadata":{},"cell_type":"markdown","source":"### Overview of the Train Data","execution_count":null},{"metadata":{"trusted":true,"_kg_hide-input":true},"cell_type":"code","source":"trainMeta.head()","execution_count":null,"outputs":[]},{"metadata":{"_kg_hide-input":true,"trusted":true},"cell_type":"code","source":"trainMeta.tail()","execution_count":null,"outputs":[]},{"metadata":{"_kg_hide-input":true,"trusted":true},"cell_type":"code","source":"print(\"Train data shape: \",trainMeta.shape)","execution_count":null,"outputs":[]},{"metadata":{"_kg_hide-input":true,"trusted":true},"cell_type":"code","source":"trainMeta.describe()","execution_count":null,"outputs":[]},{"metadata":{"trusted":true,"_kg_hide-input":true},"cell_type":"code","source":"# missing values in the train-dataset\ntrainMeta.info()","execution_count":null,"outputs":[]},{"metadata":{"_kg_hide-input":true,"trusted":true},"cell_type":"code","source":"print(\"Number of unique patients in train-data: \",trainMeta.patient_id.nunique())\nprint(\"Average number of images per patient in train-data: \",trainMeta.image_name.nunique()/trainMeta.patient_id.nunique())","execution_count":null,"outputs":[]},{"metadata":{},"cell_type":"markdown","source":"### Over view of the Test Data","execution_count":null},{"metadata":{"trusted":true},"cell_type":"code","source":"testMeta.head()","execution_count":null,"outputs":[]},{"metadata":{"trusted":true},"cell_type":"code","source":"testMeta.tail()","execution_count":null,"outputs":[]},{"metadata":{"_kg_hide-input":true,"trusted":true},"cell_type":"code","source":"print(\"Test data shape: \",testMeta.shape)","execution_count":null,"outputs":[]},{"metadata":{"trusted":true,"_kg_hide-input":true},"cell_type":"code","source":"# missing values in the test-dataset\ntestMeta.info()","execution_count":null,"outputs":[]},{"metadata":{"trusted":true,"_kg_hide-input":true},"cell_type":"code","source":"print(\"Number of unique patients in test-data: \",testMeta.patient_id.nunique())\nprint(\"Average number of images per patient in test-data: \",testMeta.image_name.nunique()/testMeta.patient_id.nunique())","execution_count":null,"outputs":[]},{"metadata":{"trusted":true,"_kg_hide-input":true},"cell_type":"code","source":"def getPiechartDistribution(feature):\n fig = go.Figure(data=[go.Pie(labels=feature.value_counts().index.values,\n values=feature.value_counts().values)])\n\n fig = fig.update_traces(hoverinfo='label+percent',\n textinfo='value',\n textfont_size=20,\n marker=dict(line=dict(color='#000000', width=1)))\n\n return fig","execution_count":null,"outputs":[]},{"metadata":{"trusted":true,"_kg_hide-input":true},"cell_type":"code","source":"# target distribution\n\ngetPiechartDistribution(trainMeta.benign_malignant).update_layout(title_text=\"Target Distribution of the Train-data\")","execution_count":null,"outputs":[]},{"metadata":{},"cell_type":"markdown","source":"### Sex","execution_count":null},{"metadata":{"trusted":true,"_kg_hide-input":true},"cell_type":"code","source":"print(\"Patients with missing value of sex: \")\nfor id in trainMeta[trainMeta.sex.isna()].patient_id.unique():\n print(id)\n# print(id in trainMeta[trainMeta.sex.notna()].patient_id.unique())\n \n# patients with missing values are not in patients with not-null sex value","execution_count":null,"outputs":[]},{"metadata":{"trusted":true,"_kg_hide-input":true},"cell_type":"code","source":"# lets check if there is any patient with more than one sex\n\nif len(np.unique(list(map(len,trainMeta.groupby(['patient_id'])['sex'].unique().values)))) == 1:\n print(\"There are no patients with more than one sex\")\nelse:\n print(\"There are patient with more than one sex\")","execution_count":null,"outputs":[]},{"metadata":{"trusted":true,"_kg_hide-input":true},"cell_type":"code","source":"getPiechartDistribution(trainMeta.groupby(['patient_id'])['sex'].first().fillna(\"NA\")).update_layout(title_text=\"Distribution of sex feature in train data\")","execution_count":null,"outputs":[]},{"metadata":{"trusted":true,"_kg_hide-input":true},"cell_type":"code","source":"getPiechartDistribution(testMeta.groupby(['patient_id'])['sex'].first().fillna(\"NA\")).update_layout(title_text=\"Distribution of sex feature in test data\")","execution_count":null,"outputs":[]},{"metadata":{},"cell_type":"markdown","source":"* Nearly same distribution of sex in train and test sets","execution_count":null},{"metadata":{"trusted":true,"_kg_hide-input":true},"cell_type":"code","source":"fig = px.histogram(trainMeta.fillna(\"NA\"), x=\"sex\", y=\"target\",color='benign_malignant',barmode=\"group\",title=\"Distribution of sex wrt to target\")\nfig.show()","execution_count":null,"outputs":[]},{"metadata":{},"cell_type":"markdown","source":"* All patients with missing value of sex have target value of 0.\n* What could be the reason behind this?","execution_count":null},{"metadata":{},"cell_type":"markdown","source":"#### Sex and Anatom-site relation","execution_count":null},{"metadata":{"trusted":true,"_kg_hide-input":true},"cell_type":"code","source":"trainMeta.fillna(\"NA\").groupby(['sex','anatom_site_general_challenge'])['target'].aggregate(['sum','count','mean']).reset_index().style.background_gradient(cmap='Reds')","execution_count":null,"outputs":[]},{"metadata":{},"cell_type":"markdown","source":"### Age","execution_count":null},{"metadata":{"trusted":true,"_kg_hide-input":true},"cell_type":"code","source":"hist_data = [trainMeta.age_approx.fillna(0).values, testMeta.age_approx.fillna(0).values]\ngroup_labels = ['train-age','test-age']\n\nfig = ff.create_distplot(hist_data, group_labels, bin_size=5.).update_layout(title='Train & Test Age distribution')\nfig.show()","execution_count":null,"outputs":[]},{"metadata":{"trusted":true,"_kg_hide-input":true},"cell_type":"code","source":"hist_data = [trainMeta[trainMeta.target==1].age_approx.fillna(0).values, trainMeta[trainMeta.target==0].age_approx.fillna(0).values]\ngroup_labels = ['Malignant','Benign']\n\nfig = ff.create_distplot(hist_data, group_labels, bin_size=5.,colors=['rgb(200,0,0)','rgb(0,200,0)']).update_layout(title='Distribution of age wrt target')\nfig.show()","execution_count":null,"outputs":[]},{"metadata":{},"cell_type":"markdown","source":"* Patients with age more than **60** are more prone to catch melanoma, maybe this could be because of **Low immunity**","execution_count":null},{"metadata":{"trusted":true,"_kg_hide-input":true},"cell_type":"code","source":"fig = px.box(trainMeta.fillna(-1),x='sex',y='age_approx',color='target',title=\"Distribution of age wrt sex\")\n\nfig.show()","execution_count":null,"outputs":[]},{"metadata":{},"cell_type":"markdown","source":"* Positive cases have median value of age more than the negative cases.\n* Males of age more than **60** & females of age more than **55** are more prone to catch melanoma.\n* Males have age distribution slightly higher than females\n* Here -1 indicates missing values. We can see that patients with missing sex values also have missing age values and do not have melanoma","execution_count":null},{"metadata":{},"cell_type":"markdown","source":"#### Age and Anatom-site relation","execution_count":null},{"metadata":{"trusted":true,"_kg_hide-input":true},"cell_type":"code","source":"trainMeta[trainMeta.age_approx>=60].fillna(\"NA\").groupby(['age_approx','anatom_site_general_challenge'])['target'].aggregate(['sum','count','mean']).sort_values(by='mean',ascending=False).reset_index().style.background_gradient(cmap='Reds') ","execution_count":null,"outputs":[]},{"metadata":{},"cell_type":"markdown","source":"### Anatom-site","execution_count":null},{"metadata":{"trusted":true,"_kg_hide-input":true},"cell_type":"code","source":"fig = px.histogram(trainMeta.fillna(\"NA\"), x=\"anatom_site_general_challenge\", y=\"benign_malignant\",color='benign_malignant',barmode=\"group\",title=\"Distribution of Anatom-site wrt to target\")\nfig.show()","execution_count":null,"outputs":[]},{"metadata":{},"cell_type":"markdown","source":"* **Torso** has more samples in the dataset, maybe because most of the lesions happen to be in this part of the body\n* Body-parts with **larger area** tend to have more samples and more **Melanoma-positive** cases.","execution_count":null},{"metadata":{"trusted":true,"_kg_hide-input":true},"cell_type":"code","source":"fig = px.histogram(testMeta.fillna(\"NA\"), x=\"anatom_site_general_challenge\", y=\"anatom_site_general_challenge\",barmode=\"group\",title=\"Distribution of Anatom-site in the Test Data\")\nfig.show()","execution_count":null,"outputs":[]},{"metadata":{},"cell_type":"markdown","source":"* Similar kind of distribution of the smaples can be seen in the Test-Data also.","execution_count":null},{"metadata":{},"cell_type":"markdown","source":"### Diagnosis","execution_count":null},{"metadata":{"trusted":true,"_kg_hide-input":true},"cell_type":"code","source":"fig = px.histogram(trainMeta.fillna(\"NA\"), x=\"diagnosis\", y=\"target\",color='benign_malignant',barmode=\"group\",title=\"Distribution of diagnosis wrt to target\")\nfig.show()","execution_count":null,"outputs":[]},{"metadata":{},"cell_type":"markdown","source":"### Patient wise data exploration","execution_count":null},{"metadata":{"trusted":true},"cell_type":"code","source":"# there is no overlapping of patients between train & test set\n\nset(trainMeta.patient_id.unique()).intersection(set(testMeta.patient_id.unique()))","execution_count":null,"outputs":[]},{"metadata":{},"cell_type":"markdown","source":"#### Images per patient in train Data wrt to target","execution_count":null},{"metadata":{"trusted":true,"_kg_hide-input":true},"cell_type":"code","source":"hist_data = [trainMeta[trainMeta.target==1].groupby('patient_id')['image_name'].count().values, trainMeta[trainMeta.target==0].groupby('patient_id')['image_name'].count().values]\ngroup_labels = ['Malignant','Benign']\n\nfig = ff.create_distplot(hist_data, group_labels, bin_size=1.,colors=['rgb(200,0,0)','rgb(0,200,0)']).update_layout(title='Distribution of images/patient in Train-data wrt target')\nfig.show()","execution_count":null,"outputs":[]},{"metadata":{},"cell_type":"markdown","source":"#### Images per patient in test Data","execution_count":null},{"metadata":{"trusted":true,"_kg_hide-input":true},"cell_type":"code","source":"hist_data = [testMeta.groupby('patient_id')['image_name'].count().values]\n\nfig = ff.create_distplot(hist_data, bin_size=1.,group_labels=['test-data']).update_layout(title='Distribution of images/patient in Test-data')\nfig.show()","execution_count":null,"outputs":[]},{"metadata":{"trusted":true,"_kg_hide-input":true},"cell_type":"code","source":"hist_data = [trainMeta[trainMeta.target==1].fillna(0).groupby(['patient_id'])['age_approx'].max().values - trainMeta[trainMeta.target==1].fillna(0).groupby(['patient_id'])['age_approx'].min().values, trainMeta[trainMeta.target==0].fillna(0).groupby(['patient_id'])['age_approx'].max().values - trainMeta[trainMeta.target==0].fillna(0).groupby(['patient_id'])['age_approx'].min().values]\ngroup_labels = ['Malignant','Benign']\n\nfig = ff.create_distplot(hist_data, group_labels, bin_size=1.,colors=['rgb(200,0,0)','rgb(0,200,0)']).update_layout(title='Distribution of age-diff of patients wrt to target in Train-data')\nfig.show()","execution_count":null,"outputs":[]},{"metadata":{"trusted":true,"_kg_hide-input":true},"cell_type":"code","source":"hist_data = [testMeta.fillna(0).groupby(['patient_id'])['age_approx'].max().values - testMeta.fillna(0).groupby(['patient_id'])['age_approx'].min().values]\n\nfig = ff.create_distplot(hist_data, bin_size=1.,group_labels=['test-data']).update_layout(title='Distribution of age-diff of patients in Test-data')\nfig.show()","execution_count":null,"outputs":[]},{"metadata":{},"cell_type":"markdown","source":"### Image Data\n\n---\nUse the “**ABCDE rule**” to look for some of the common signs of melanoma, one of the deadliest forms of skin cancer:\n\n[Source](https://fwderm.com/skin-conditions/moles/)\n\n---\n\n**Moles** \n\nMoles are common. Almost every adult has a few moles. Adults who have light skin often have more moles. They may have 10 to 40 moles on their skin. This is normal.\n\nYou should not be overly worried about your moles. \n\n---\n\n**But you should know**:\n* A type of skin cancer, melanoma, can grow in or near a mole. \n* Caught early and treated, melanoma can be cured. \n* The first sign of melanoma is often a change to a mole — or a new mole on your skin. \n* Checking your skin can help you find melanoma early. A dermatologist can show you how to examine your skin and tell you how often you should check your skin. \n\n---\n","execution_count":null},{"metadata":{},"cell_type":"markdown","source":"#### Images of a random Patient with Melanoma from the train-data","execution_count":null},{"metadata":{"trusted":true,"_kg_hide-input":true},"cell_type":"code","source":"for patient_id in np.random.choice(trainMeta[trainMeta.target==1].fillna(\"NA\").patient_id.unique(),size=1,replace=False):\n x = trainMeta[trainMeta.patient_id == patient_id].sort_values(['age_approx','image_name'])\n \n r, c = int(np.ceil(x.shape[0]/5)), 5\n \n fig, ax = plt.subplots(r,c, figsize=(20,4*r))\n \n fig = fig.suptitle(f'{patient_id} Sex: {x.sex.values[0]}',fontsize=20)\n \n for i, image_name in enumerate(x.image_name.values):\n img = cv2.imread(DATA_PATH + f'jpeg/train/{image_name}.jpg')\n img = cv2.cvtColor(img,cv2.COLOR_BGR2RGB)\n \n if x.benign_malignant.values[i] == \"malignant\":\n color = \"red\"\n else:\n color = \"black\"\n \n if r>1:\n ax[i//5,i%5].imshow(img)\n ax[i//5,i%5].set_title(f\"{x.age_approx.values[i]} {x.benign_malignant.values[i]} {x.anatom_site_general_challenge.values[i]}\",color=color)\n else:\n ax[i%5].imshow(img)\n ax[i%5].set_title(f\"{x.age_approx.values[i]} {x.benign_malignant.values[i]} {x.anatom_site_general_challenge.values[i]}\",color=color)\n \n plt.savefig(f'{x.target.sum()}_{patient_id}_{x.sex.values[0]}.png')\n\nplt.show()","execution_count":null,"outputs":[]},{"metadata":{},"cell_type":"markdown","source":"#### Images of a random Patient without Melanoma from the train-data","execution_count":null},{"metadata":{"_kg_hide-input":true,"trusted":true},"cell_type":"code","source":"for patient_id in np.random.choice(trainMeta[trainMeta.target==0].fillna(\"NA\").patient_id.unique(),size=1,replace=False):\n x = trainMeta[trainMeta.patient_id == patient_id].sort_values(['age_approx','image_name'])\n \n r, c = int(np.ceil(x.shape[0]/5)), 5\n \n fig, ax = plt.subplots(r,c, figsize=(20,4*r))\n \n fig = fig.suptitle(f'{patient_id} Sex: {x.sex.values[0]}',fontsize=20)\n \n for i, image_name in enumerate(x.image_name.values):\n img = cv2.imread(DATA_PATH + f'jpeg/train/{image_name}.jpg')\n img = cv2.cvtColor(img,cv2.COLOR_BGR2RGB)\n \n if x.benign_malignant.values[i] == \"malignant\":\n color = \"red\"\n else:\n color = \"black\"\n \n if r>1:\n ax[i//5,i%5].imshow(img)\n ax[i//5,i%5].set_title(f\"{x.age_approx.values[i]} {x.benign_malignant.values[i]} {x.anatom_site_general_challenge.values[i]}\",color=color)\n else:\n ax[i%5].imshow(img)\n ax[i%5].set_title(f\"{x.age_approx.values[i]} {x.benign_malignant.values[i]} {x.anatom_site_general_challenge.values[i]}\",color=color)\n \n plt.savefig(f'{x.target.sum()}_{patient_id}_{x.sex.values[0]}.png')\n\nplt.show()","execution_count":null,"outputs":[]},{"metadata":{},"cell_type":"markdown","source":"#### Images of a random Patient from the test-data","execution_count":null},{"metadata":{"_kg_hide-input":true,"trusted":true},"cell_type":"code","source":"for patient_id in np.random.choice(testMeta.fillna(\"NA\").patient_id.unique(),size=1,replace=False):\n x = testMeta[testMeta.patient_id == patient_id].sort_values(['age_approx','image_name'])\n \n r, c = int(np.ceil(x.shape[0]/5)), 5\n \n fig, ax = plt.subplots(r,c, figsize=(20,4*r))\n \n fig = fig.suptitle(f'{patient_id} Sex: {x.sex.values[0]}',fontsize=20)\n \n for i, image_name in enumerate(x.image_name.values):\n img = cv2.imread(DATA_PATH + f'jpeg/test/{image_name}.jpg')\n img = cv2.cvtColor(img,cv2.COLOR_BGR2RGB)\n \n if r>1:\n ax[i//5,i%5].imshow(img)\n ax[i//5,i%5].set_title(f\"{x.age_approx.values[i]} {x.anatom_site_general_challenge.values[i]} {image_name}\")\n else:\n ax[i%5].imshow(img)\n ax[i%5].set_title(f\"{x.age_approx.values[i]} {x.anatom_site_general_challenge.values[i]} {image_name}\")\n \n# plt.savefig(f'{x.target.sum()}_{patient_id}_{x.sex.values[0]}.png')\n\nplt.show()","execution_count":null,"outputs":[]},{"metadata":{},"cell_type":"markdown","source":"## 4. Data Augmentation","execution_count":null},{"metadata":{},"cell_type":"markdown","source":"### Sample Image","execution_count":null},{"metadata":{"trusted":true,"_kg_hide-input":true},"cell_type":"code","source":"image_folder_path = '../input/siim-isic-melanoma-classification/jpeg/train/'\nimageName = np.random.choice(trainMeta[trainMeta.target==1].image_name.values)\nsampleImage = cv2.imread(os.path.join(image_folder_path, f'{imageName}.jpg'))[:,:,::-1]\nplt.title(f'{imageName} - {trainMeta[trainMeta.image_name==imageName].target.values}')\nplt.imshow(sampleImage)","execution_count":null,"outputs":[]},{"metadata":{},"cell_type":"markdown","source":"### Random Augmentations","execution_count":null},{"metadata":{"trusted":true,"_kg_hide-input":true},"cell_type":"code","source":"transforms = ['Identity','RandomBrightness','RandomContrast','Crop','FlipLeftRight','FlipUpDown','RandomSaturation','Rot90','Rot180','Rot270']\n\ndef randAugment(image=sampleImage,N=3):\n \n augmentations = np.random.choice(transforms,N,replace=False)\n \n image = tf.cast(image, tf.float32) / 255.0\n \n for transform in augmentations:\n\n if transform=='Identity':\n continue\n\n elif transform=='RandomBrightness':\n image = tf.image.random_brightness(image,max_delta=0.2)\n \n elif transform=='RandomContrast':\n image = tf.image.random_contrast(image,1.0,3.0)\n \n elif transform=='Crop':\n# image = tf.image.random_crop(image,[512,512,3])\n image = tf.image.central_crop(image,0.5)\n \n elif transform=='FlipLeftRight':\n image = tf.image.flip_left_right(image)\n \n elif transform=='FlipUpDown':\n image = tf.image.flip_up_down(image)\n \n elif transform=='RandomSaturation':\n image = tf.image.random_saturation(image,0.6,1.5)\n \n elif transform=='Rot90':\n image = tf.image.rot90(image,k=1)\n \n elif transform=='Rot180':\n image = tf.image.rot90(image,k=2)\n \n elif transform=='Rot270':\n image = tf.image.rot90(image,k=3)\n \n image = tf.image.resize(image,(450,600))\n# image = cv2.resize(image.numpy(),(600,450))\n# print(np.all(image1.numpy()==image1))\n \n return image, augmentations","execution_count":null,"outputs":[]},{"metadata":{"trusted":true,"_kg_hide-input":true},"cell_type":"code","source":"r, c = 3, 5\n\nfig, ax = plt.subplots(r,c, figsize=(25,5*r))\n\nfig = fig.suptitle(f\"Image Augmentation of {imageName} - {trainMeta[trainMeta.image_name==imageName].target.values}\",fontsize=20)\n\nfor i in range(r*c):\n img, augmentations = randAugment(sampleImage,5)\n\n ax[i//5,i%5].imshow(img)\n ax[i//5,i%5].set_title(\"-\".join(augmentations[:2]) + \"\\n\" + \"-\".join(augmentations[2:]))\n\n# plt.savefig(f'{x.target.sum()}_{patient_id}_{x.sex.values[0]}.png')\n\nplt.show()","execution_count":null,"outputs":[]},{"metadata":{},"cell_type":"markdown","source":"## 5. Validation Strategy - Stratified Group K-Fold\nhttps://www.kaggle.com/jakubwasikowski/stratified-group-k-fold-cross-validation","execution_count":null},{"metadata":{"trusted":true,"_kg_hide-input":false},"cell_type":"code","source":"def stratified_group_k_fold(X, y, groups, k, seed=None):\n labels_num = np.max(y) + 1\n y_counts_per_group = defaultdict(lambda: np.zeros(labels_num))\n y_distr = Counter()\n for label, g in zip(y, groups):\n y_counts_per_group[g][label] += 1\n y_distr[label] += 1\n\n y_counts_per_fold = defaultdict(lambda: np.zeros(labels_num))\n groups_per_fold = defaultdict(set)\n\n def eval_y_counts_per_fold(y_counts, fold):\n y_counts_per_fold[fold] += y_counts\n std_per_label = []\n for label in range(labels_num):\n label_std = np.std([y_counts_per_fold[i][label] / y_distr[label] for i in range(k)])\n std_per_label.append(label_std)\n y_counts_per_fold[fold] -= y_counts\n return np.mean(std_per_label)\n \n groups_and_y_counts = list(y_counts_per_group.items())\n random.Random(seed).shuffle(groups_and_y_counts)\n\n for g, y_counts in sorted(groups_and_y_counts, key=lambda x: -np.std(x[1])):\n best_fold = None\n min_eval = None\n for i in range(k):\n fold_eval = eval_y_counts_per_fold(y_counts, i)\n if min_eval is None or fold_eval < min_eval:\n min_eval = fold_eval\n best_fold = i\n y_counts_per_fold[best_fold] += y_counts\n groups_per_fold[best_fold].add(g)\n\n all_groups = set(groups)\n \n for i in range(k):\n train_groups = all_groups - groups_per_fold[i]\n test_groups = groups_per_fold[i]\n\n train_indices = [i for i, g in enumerate(groups) if g in train_groups]\n test_indices = [i for i, g in enumerate(groups) if g in test_groups]\n\n yield train_indices, test_indices","execution_count":null,"outputs":[]},{"metadata":{"trusted":true,"_kg_hide-input":false},"cell_type":"code","source":"def get_stratify_group(row):\n stratify_group = row['sex']\n# stratify_group += f'_{row[\"age_approx\"]}'\n stratify_group += f'_{row[\"anatom_site_general_challenge\"]}'\n stratify_group += f'_{row[\"target\"]}'\n return stratify_group","execution_count":null,"outputs":[]},{"metadata":{"trusted":true,"_kg_hide-input":false},"cell_type":"code","source":"%%time\n\ntrain = trainMeta.copy()\ntrain['stratify_group'] = train.fillna(\"NA\").apply(get_stratify_group, axis=1)\ntrain['stratify_group'] = train['stratify_group'].astype('category').cat.codes\n\ntrain['fold'] = 0\n\nk = 5\nfor fold_ind, (train_ind, val_ind) in enumerate(stratified_group_k_fold(trainMeta, train.stratify_group.values, trainMeta.patient_id.values, k=k, seed=SEED)):\n train.loc[val_ind,'fold'] = fold_ind\n\ntrain.fold.value_counts(normalize=True)","execution_count":null,"outputs":[]},{"metadata":{"trusted":true,"_kg_hide-input":false},"cell_type":"code","source":"for i in range(5):\n for j in range(i+1,5):\n print(f\"fold_{i} intersection fold_{j}: {set(train[train.fold==i].patient_id).intersection(set(train[train.fold==j].patient_id))}\")","execution_count":null,"outputs":[]},{"metadata":{"trusted":true,"_kg_hide-input":true},"cell_type":"code","source":"fig = px.histogram(train.fillna(\"NA\"), x=\"benign_malignant\", y=\"target\",color='fold',barmode=\"group\",title=\"Distribution of Targets wrt to Folds\")\nfig.show()","execution_count":null,"outputs":[]},{"metadata":{"trusted":true,"_kg_hide-input":true},"cell_type":"code","source":"fig = px.histogram(train.fillna(\"NA\"), x=\"anatom_site_general_challenge\", y=\"anatom_site_general_challenge\",color='fold',barmode=\"group\",title=\"Distribution of Anatom-site wrt folds\")\nfig.show()","execution_count":null,"outputs":[]},{"metadata":{"trusted":true,"_kg_hide-input":true},"cell_type":"code","source":"fig = px.histogram(train.fillna(\"NA\"), x=\"sex\", y=\"sex\",color='fold',barmode=\"group\",title=\"Distribution of Sex wrt folds\")\nfig.show()","execution_count":null,"outputs":[]},{"metadata":{"trusted":true,"_kg_hide-input":true},"cell_type":"code","source":"fig = px.histogram(train.fillna(\"NA\"), x=\"age_approx\", y=\"age_approx\",color='fold',barmode=\"group\",title=\"Distribution of Age wrt folds\")\nfig.show()","execution_count":null,"outputs":[]},{"metadata":{"trusted":true},"cell_type":"code","source":"train.head()","execution_count":null,"outputs":[]},{"metadata":{"trusted":true},"cell_type":"code","source":"# train.to_csv('train_StratifiedGroupK(5)Fold(SEED2020)(Group_sex_anatomsite_target).csv',index=False)","execution_count":null,"outputs":[]},{"metadata":{},"cell_type":"markdown","source":"## 6. Base Model using Meta-data","execution_count":null},{"metadata":{"trusted":true,"_kg_hide-input":true},"cell_type":"code","source":"y = train.target\nfolds = train.fold\nX = train.drop(['target','benign_malignant','diagnosis','stratify_group','fold','image_name'],axis=1)\nX.head()","execution_count":null,"outputs":[]},{"metadata":{"trusted":true,"_kg_hide-input":true},"cell_type":"code","source":"X.sex = X.sex.fillna(\"unknown\")\nX.anatom_site_general_challenge = X.anatom_site_general_challenge.fillna(\"unknown\")\nX.age_approx = X.age_approx.fillna(0)\n\nX_test = testMeta.copy()\nX_test.anatom_site_general_challenge = X_test.anatom_site_general_challenge.fillna(\"unknown\")","execution_count":null,"outputs":[]},{"metadata":{"trusted":true,"_kg_hide-input":true},"cell_type":"code","source":"def labelEncoder(train,val,test,columns):\n for col in columns:\n le = LabelEncoder() \n train[f'le_{col}'] = le.fit_transform(train[col])\n val[f'le_{col}'] = le.transform(val[col])\n test[f'le_{col}'] = le.transform(test[col])\n \n return train,val,test\n\ndef oneHotEncode(train,val,test,cols):\n train['temp'] = 0\n val['temp'] = 1\n test['temp'] = 2\n \n temp = pd.get_dummies(pd.concat([train,val,test],axis=0),columns=cols,drop_first=True)\n \n train = temp[temp.temp==0]\n val = temp[temp.temp==1]\n test = temp[temp.temp==2]\n \n train.drop(['temp'],inplace=True,axis=1)\n val.drop(['temp'],inplace=True,axis=1)\n test.drop(['temp'],inplace=True,axis=1)\n \n return train, val, test\n\n\ndef standardScale(X_train,X_val,test,cols):\n \n for col in cols:\n ss = StandardScaler()\n X_train[f'std_{col}'] = ss.fit_transform(X_train[col].values.reshape(-1,1))\n X_val[f'std_{col}'] = ss.transform(X_val[col].values.reshape(-1,1))\n test[f'std_{col}'] = ss.transform(test[col].values.reshape(-1,1))\n\n return X_train, X_val, test\n\n\ndef targetEncode(X_train,y_train,X_val,X_test,cols):\n \n X = pd.concat([X_train,y_train],axis=1)\n \n alpha = 15\n global_mean = y_train.mean()\n \n for col in cols:\n encodings = dict((X.groupby([col])['target'].sum() + alpha*global_mean)/(alpha + X.groupby([col])['target'].count()))\n X_train[f'te_{col}'] = X_train[col].map(encodings).fillna(global_mean)\n X_val[f'te_{col}'] = X_val[col].map(encodings).fillna(global_mean)\n X_test[f'te_{col}'] = X_test[col].map(encodings).fillna(global_mean)\n \n return X_train, X_val, X_test\n\n\ndef featureInteractions(X_train,X_val,X_test,cols):\n \n for i in range(len(cols)):\n for j in range(i+1,len(cols)):\n X_train[f'{cols[i]}_{cols[j]}'] = f'{X_train[cols[i]]}_{X_train[cols[j]]}'\n X_val[f'{cols[i]}_{cols[j]}'] = f'{X_val[cols[i]]}_{X_val[cols[j]]}'\n X_test[f'{cols[i]}_{cols[j]}'] = f'{X_test[cols[i]]}_{X_test[cols[j]]}'\n \n return X_train, X_val, X_test\n \n \n \ndef preprocessData(X_train,y_train,X_val,X_test):\n \n data = [X_train,X_val,X_test]\n \n # Sun-Exposed or not feature\n# for X in data:\n# X['sun_exposed'] = X.anatom_site_general_challenge.map({'torso':1,'lower extremity':2,'upper extremity':2,'head/neck':3,'unknown':0,'palms/soles':0,'oral/genital':0})\n \n # Feature Interactions\n# X_train, X_val, X_test = featureInteractions(X_train,X_val,X_test,['sex','age_approx','anatom_site_general_challenge'])\n# X_train[\"_\".join(['sex','age_approx','anatom_site_general_challenge'])] = f'{X_train[\"sex\"]}_{X_train[\"age_approx\"]}_{X_train[\"anatom_site_general_challenge\"]}'\n# X_val[\"_\".join(['sex','age_approx','anatom_site_general_challenge'])] = f'{X_val[\"sex\"]}_{X_val[\"age_approx\"]}_{X_val[\"anatom_site_general_challenge\"]}'\n# X_test[\"_\".join(['sex','age_approx','anatom_site_general_challenge'])] = f'{X_test[\"sex\"]}_{X_test[\"age_approx\"]}_{X_test[\"anatom_site_general_challenge\"]}'\n\n \n \n X_train, X_val, X_test = standardScale(X_train,X_val,X_test,['age_approx'])\n \n \n# X_train,X_val,X_test = labelEncoder(X_train,X_val,X_test,['sex','age_approx','anatom_site_general_challenge'])\n# X_train, X_val, X_test = targetEncode(X_train,y_train,X_val,X_test,\n# [col for col in ['sex','age_approx','anatom_site_general_challenge','sex_age_approx','sex_anatom_site_general_challenge','age_approx_anatom_site_general_challenge',\"_\".join(['sex','age_approx','anatom_site_general_challenge'])] if col in X_train.columns])\n X_train, X_val, X_test = oneHotEncode(X_train,X_val,X_test,cols=[col for col in ['anatom_site_general_challenge','sex','sex_age_approx','sex_anatom_site_general_challenge','age_approx_anatom_site_general_challenge'] if col in X_train.columns])\n \n \n # Drop unwanted columns\n dropCols = list(X_train.dtypes[X_train.dtypes=='object'].index.values) + ['age_approx']\n X_train = X_train.drop(dropCols,axis=1)\n X_val = X_val.drop(dropCols,axis=1)\n X_test = X_test.drop(dropCols,axis=1)\n \n# print(X_train.columns)\n \n return X_train, X_val, X_test","execution_count":null,"outputs":[]},{"metadata":{},"cell_type":"markdown","source":"### Training","execution_count":null},{"metadata":{"trusted":true,"_kg_hide-input":false},"cell_type":"code","source":"def trainOnMetaData(X,y,X_test,folds):\n \n CVScores = []\n \n valPred = y.copy()\n \n testPred = {}\n \n for fold in range(k):\n val_idx = X[folds==fold].index\n train_idx = X[folds!=fold].index\n \n X_val, y_val = X.iloc[val_idx], y.iloc[val_idx]\n X_train, y_train = X.iloc[train_idx], y.iloc[train_idx]\n test = X_test[X_train.columns].copy()\n \n # Preprocessing\n X_train, X_val, test = preprocessData(X_train,y_train,X_val,test)\n \n model = LogisticRegression(n_jobs=-1,random_state=SEED,max_iter=100)\n \n model.fit(X_train,y_train)\n \n print(f'\\nFold {fold}: ')\n print('----------------')\n \n valPred.iloc[val_idx] = model.predict_proba(X_val)[:,1]\n \n valScore = roc_auc_score(y_val,valPred.iloc[val_idx])\n print(\"Validation Score: \",valScore)\n CVScores.append(valScore)\n \n print(\"\\nCoeff: \",dict(zip(X_train.columns,model.coef_[0])))\n# print(\"\\nFeature Importance: \",dict(zip(X_train.columns,model.feature_importances_)))\n \n testPred[f'fold_{fold}'] = model.predict_proba(test)[:,1]\n \n print(f\"\\nMean CV Score: {np.mean(CVScores)} +/- {np.std(CVScores)}\")\n \n return CVScores, valPred, pd.DataFrame(testPred)","execution_count":null,"outputs":[]},{"metadata":{"trusted":true},"cell_type":"code","source":"CVScores, valPred, testPred = trainOnMetaData(X,y,X_test,folds)","execution_count":null,"outputs":[]},{"metadata":{},"cell_type":"markdown","source":"## 7. Inference","execution_count":null},{"metadata":{"trusted":true,"_kg_hide-input":true},"cell_type":"code","source":"def visualizeResults(CVScores,valPred,testPred):\n \n fig, ax = plt.subplots(1,3,figsize=(18,5))\n fig.suptitle(\"Results\",fontsize=20)\n \n sns.barplot(x=list(range(k)),y=CVScores, ax=ax[0])\n ax[0].set_title(f\"CV-Scores of {k}-Folds\")\n \n sns.kdeplot(testPred.mean(axis=1),shade=True,ax=ax[1])\n ax[1].set_title(\"Distribution of Testset Predictions\")\n \n sns.kdeplot(valPred[y==0],label='benign',shade=True,ax=ax[2])\n sns.kdeplot(valPred[y==1],label='malignant',shade=True,ax=ax[2])\n ax[2].set_title('Distribution of Cross-Validation set Predictions')","execution_count":null,"outputs":[]},{"metadata":{"trusted":true,"_kg_hide-input":true},"cell_type":"code","source":"visualizeResults(CVScores,valPred,testPred)","execution_count":null,"outputs":[]},{"metadata":{"trusted":true,"_kg_hide-input":true},"cell_type":"code","source":"hist_data = [valPred[folds==fold] for fold in range(k)]\ngroup_labels = [f'fold_{fold}' for fold in range(k)]\n\nfig = ff.create_distplot(hist_data, group_labels, show_hist=False).update_layout(title='Distribution of Cross Validation Set Predictions wrt of folds')\nfig.show()","execution_count":null,"outputs":[]},{"metadata":{"trusted":true,"_kg_hide-input":true},"cell_type":"code","source":"def saveResults(valPred,testPred,CVScores,modelName):\n \n sampleSubmission.iloc[:,1] = testPred.mean(axis=1)\n sampleSubmission.to_csv(f'{date.today()}_Test_{modelName}_{np.mean(CVScores)}.csv',index=False)\n \n val = pd.DataFrame(train['image_name']) \n val['target'] = valPred\n\n val.to_csv(f'{date.today()}_Val_{modelName}_{np.mean(CVScores)}.csv',index=False)","execution_count":null,"outputs":[]},{"metadata":{"trusted":true},"cell_type":"code","source":"saveResults(valPred,testPred,CVScores,'LogisticRegression')\nos.listdir('/kaggle/working/')","execution_count":null,"outputs":[]},{"metadata":{},"cell_type":"markdown","source":" Please!!! Upvote this kernel if you find it useful. ","execution_count":null}],"metadata":{"kernelspec":{"language":"python","display_name":"Python 3","name":"python3"},"language_info":{"pygments_lexer":"ipython3","nbconvert_exporter":"python","version":"3.6.4","file_extension":".py","codemirror_mode":{"name":"ipython","version":3},"name":"python","mimetype":"text/x-python"}},"nbformat":4,"nbformat_minor":4}