
On behalf of the Breakthrough Listen team, I'd like to thank all of the competitors for their fantastic efforts in this competition. I'd also like to thank the team at Kaggle for their superb support during the time it took to put this competition together, and I'd like to extend my particular gratitude to our amazing undergraduate intern, Yuhong Chen, who was instrumental in putting together the dataset for this challenge. We want to encourage you to stay connected with us on this important work. See below for opportunities to continue your contributions to our search.
\nI'd like to tell you a bit more about the Kaggle dataset than we did at the start of the competition. Since we don't have any real examples of ET signals (yet!) we turned to setigen - as some of you figured out - to inject our \"needle\" signals into real data from the Green Bank Telescope. The individual spectrogram files (containing detected power as a function of frequency and time) from GBT can be tens of GB in size. Each represents a five minute scan on a target, typically as part of a cadence of three \"ON\" scans interspersed with three \"OFF\" scans. We generate three versions of each of the six scans in a cadence, by passing the raw data from GBT (which are tens of times larger still than the spectrograms) through three different Fourier transforms. This gives us different combinations of time and frequency resolution, as described in this paper. The data product that we typically use for SETI analyses (e.g. https://arxiv.org/pdf/2101.11137.pdf) consists of hundreds of millions of frequency channels, and just 16 time steps. We normally run this through custom code called \"turboSETI\" which searches for narrowband Doppler drifting signals (essentially diagonal lines in the spectrograms).
\nIf you'd like to try running some of our data through turboSETI, Elan Lavie, a high school teacher working with us last summer, analyzed some observations of Voyager 1, which we can detect using the existing algorithms in a blind search, even though it's 20 billion kilometers from Earth. And one of our undergraduate students, Ellie White, put together a Kaggle notebook that does a similar search for the Mars2020 spacecraft, as it was en route to Mars earlier this year.
\n
These searches use the fine frequency resolution data product (one of the three different resolution spectrograms discussed above). One of the other versions of the same underlying data has a few hundred thousand frequency channels, and 273 time steps. This is the one that we used as the basis for the Kaggle competition, in order to be able to give you arrays of data that were approximately square, and more amenable to image processing algorithms than snippets extracted from the data product with only 16 time steps. Yuhong extracted regions of the mid-resolution files corresponding to 256 frequency channels, or about 700 kHz out of the overall ~1 GHz wide band. This is what we call the \"cadence snippets\".
\nYuhong then used setigen to add artificial signals into just the ON observations of some of these cadence snippets, mimicking what we would expect to see for an alien signal (or for a signal from a probe like Voyager 1 or Mars 2020). As we demonstrated with those spacecraft scans, the simple narrowband Doppler search with turboSETI is actually pretty good at finding interesting candidates. But turboSETI isn't great at finding signals in crowded regions of the spectrum with lots of human-generated radio frequency interference (from satellites, cellphones, and the like) or at finding signals that aren't neat diagonal lines. That's why we needed your help to build algorithms that perform better in these conditions.
\nInjecting these signals into the data perturbs the statistics of the images, though, and we didn't want competitors to just be able to plot histograms of the images and immediately see which ones had signals in them. In itself, that would not be a bad technique to use for SETI (although it would result in more false positives than the Doppler drift search) but we were interested in exploring computer vision algorithms or other methods to isolate signals (and anomalies) in noisy backgrounds. So after the signal injection, we rescaled the data to match the histograms across a cadence. Hiding these needles (candidates) in the haystack of real data turned out to be pretty challenging to do without giving the game away, and as many of you know there were a couple of subtle data leaks that caught us out. We appreciated your patience as we regenerated the data. At the reboot, we also made the signals fainter, and added an additional signal type, because Kagglers had been doing too well on the initial problem, even before the data leak!
\nThe main issue that we faced when setting up this challenge is that we don't have any real examples of ET signals. We do know qualitatively how we would expect such signals to appear in our data, but building generalized anomaly detection algorithms to find them isn't easy. Your submissions have given us several promising new avenues for doing so, though.
\nIt's going to take us a while to digest the results and figure out how we can best apply them to our real-world signal detection problem, and we could use your help. Feel free to reach out to me personally (scroft@berkeleyDELETE_THIS_STRING_IF_YOU_ARE_NOT_A_ROBOT.edu - subject: Kaggle) if you'd like to be added to our Slack workspace, if you'd be interested in participating in a Zoom call about some of our data analysis challenges, or if you have some time to volunteer to work with us. We have several folks from the tech industry collaborating with us at the moment and we'd welcome additional machine learning expertise to help us advance our signal processing abilities.
\nYou can also check out some more of our tutorial materials and code on github - a good place to start is https://github.com/UCBerkeleySETI/breakthrough/blob/master/GBT/README.md - read our blog at http://seti.berkeley.edu/blog , and follow us on Facebook, Twitter, Instagram, and YouTube.
\nThanks again for all of your efforts and we appreciate your help in pushing forward our capabilities as we attempt to answer one of the most profound questions in science: Are we alone?
", "messages": [ { "id": 1497077, "postDate": "2021-08-30T23:04:58.527Z", "content": "On behalf of the Breakthrough Listen team, I'd like to thank all of the competitors for their fantastic efforts in this competition. I'd also like to thank the team at Kaggle for their superb support during the time it took to put this competition together, and I'd like to extend my particular gratitude to our amazing undergraduate intern, Yuhong Chen, who was instrumental in putting together the dataset for this challenge. We want to encourage you to stay connected with us on this important work. See below for opportunities to continue your contributions to our search.
\nI'd like to tell you a bit more about the Kaggle dataset than we did at the start of the competition. Since we don't have any real examples of ET signals (yet!) we turned to setigen - as some of you figured out - to inject our \"needle\" signals into real data from the Green Bank Telescope. The individual spectrogram files (containing detected power as a function of frequency and time) from GBT can be tens of GB in size. Each represents a five minute scan on a target, typically as part of a cadence of three \"ON\" scans interspersed with three \"OFF\" scans. We generate three versions of each of the six scans in a cadence, by passing the raw data from GBT (which are tens of times larger still than the spectrograms) through three different Fourier transforms. This gives us different combinations of time and frequency resolution, as described in this paper. The data product that we typically use for SETI analyses (e.g. https://arxiv.org/pdf/2101.11137.pdf) consists of hundreds of millions of frequency channels, and just 16 time steps. We normally run this through custom code called \"turboSETI\" which searches for narrowband Doppler drifting signals (essentially diagonal lines in the spectrograms).
\nIf you'd like to try running some of our data through turboSETI, Elan Lavie, a high school teacher working with us last summer, analyzed some observations of Voyager 1, which we can detect using the existing algorithms in a blind search, even though it's 20 billion kilometers from Earth. And one of our undergraduate students, Ellie White, put together a Kaggle notebook that does a similar search for the Mars2020 spacecraft, as it was en route to Mars earlier this year.
\n
These searches use the fine frequency resolution data product (one of the three different resolution spectrograms discussed above). One of the other versions of the same underlying data has a few hundred thousand frequency channels, and 273 time steps. This is the one that we used as the basis for the Kaggle competition, in order to be able to give you arrays of data that were approximately square, and more amenable to image processing algorithms than snippets extracted from the data product with only 16 time steps. Yuhong extracted regions of the mid-resolution files corresponding to 256 frequency channels, or about 700 kHz out of the overall ~1 GHz wide band. This is what we call the \"cadence snippets\".
\nYuhong then used setigen to add artificial signals into just the ON observations of some of these cadence snippets, mimicking what we would expect to see for an alien signal (or for a signal from a probe like Voyager 1 or Mars 2020). As we demonstrated with those spacecraft scans, the simple narrowband Doppler search with turboSETI is actually pretty good at finding interesting candidates. But turboSETI isn't great at finding signals in crowded regions of the spectrum with lots of human-generated radio frequency interference (from satellites, cellphones, and the like) or at finding signals that aren't neat diagonal lines. That's why we needed your help to build algorithms that perform better in these conditions.
\nInjecting these signals into the data perturbs the statistics of the images, though, and we didn't want competitors to just be able to plot histograms of the images and immediately see which ones had signals in them. In itself, that would not be a bad technique to use for SETI (although it would result in more false positives than the Doppler drift search) but we were interested in exploring computer vision algorithms or other methods to isolate signals (and anomalies) in noisy backgrounds. So after the signal injection, we rescaled the data to match the histograms across a cadence. Hiding these needles (candidates) in the haystack of real data turned out to be pretty challenging to do without giving the game away, and as many of you know there were a couple of subtle data leaks that caught us out. We appreciated your patience as we regenerated the data. At the reboot, we also made the signals fainter, and added an additional signal type, because Kagglers had been doing too well on the initial problem, even before the data leak!
\nThe main issue that we faced when setting up this challenge is that we don't have any real examples of ET signals. We do know qualitatively how we would expect such signals to appear in our data, but building generalized anomaly detection algorithms to find them isn't easy. Your submissions have given us several promising new avenues for doing so, though.
\nIt's going to take us a while to digest the results and figure out how we can best apply them to our real-world signal detection problem, and we could use your help. Feel free to reach out to me personally (scroft@berkeleyDELETE_THIS_STRING_IF_YOU_ARE_NOT_A_ROBOT.edu - subject: Kaggle) if you'd like to be added to our Slack workspace, if you'd be interested in participating in a Zoom call about some of our data analysis challenges, or if you have some time to volunteer to work with us. We have several folks from the tech industry collaborating with us at the moment and we'd welcome additional machine learning expertise to help us advance our signal processing abilities.
\nYou can also check out some more of our tutorial materials and code on github - a good place to start is https://github.com/UCBerkeleySETI/breakthrough/blob/master/GBT/README.md - read our blog at http://seti.berkeley.edu/blog , and follow us on Facebook, Twitter, Instagram, and YouTube.
\nThanks again for all of your efforts and we appreciate your help in pushing forward our capabilities as we attempt to answer one of the most profound questions in science: Are we alone?
", "rawMarkdown": "On behalf of the Breakthrough Listen team, I'd like to thank all of the competitors for their fantastic efforts in this competition. I'd also like to thank the team at Kaggle for their superb support during the time it took to put this competition together, and I'd like to extend my particular gratitude to our amazing undergraduate intern, Yuhong Chen, who was instrumental in putting together the dataset for this challenge. We want to encourage you to stay connected with us on this important work. See below for opportunities to continue your contributions to our search. \n\nI'd like to tell you a bit more about the Kaggle dataset [than we did at the start of the competition](https://www.kaggle.com/c/seti-breakthrough-listen/overview/data-information). Since we don't have any real examples of ET signals (yet!) we turned to [setigen](https://github.com/bbrzycki/setigen) - as some of you figured out - to inject our \"needle\" signals into real data from the Green Bank Telescope. The individual spectrogram files (containing detected power as a function of frequency and time) from GBT can be tens of GB in size. Each represents a five minute scan on a target, typically as part of a cadence of three \"ON\" scans interspersed with three \"OFF\" scans. We generate three versions of each of the six scans in a cadence, by passing the raw data from GBT (which are tens of times larger still than the spectrograms) through three different Fourier transforms. This gives us different combinations of time and frequency resolution, as described in [this paper](https://arxiv.org/pdf/1906.07391.pdf). The data product that we typically use for SETI analyses (e.g. https://arxiv.org/pdf/2101.11137.pdf) consists of hundreds of millions of frequency channels, and just 16 time steps. We normally run this through custom code called [\"turboSETI\"](https://github.com/UCBerkeleySETI/turbo_seti) which searches for narrowband Doppler drifting signals (essentially diagonal lines in the spectrograms).\n\nIf you'd like to try running some of our data through turboSETI, Elan Lavie, a high school teacher working with us last summer, analyzed some observations of Voyager 1, [which we can detect](https://github.com/elanlavie/VoyagerTutorialRepository/blob/master/VoyagerTutorial.ipynb) using the existing algorithms in a blind search, even though it's 20 billion kilometers from Earth. And one of our undergraduate students, Ellie White, put together [a Kaggle notebook](https://www.kaggle.com/elliewhite/breakthrough-listen-mars-tutorial) that does a similar search for the Mars2020 spacecraft, as it was en route to Mars earlier this year.\n\n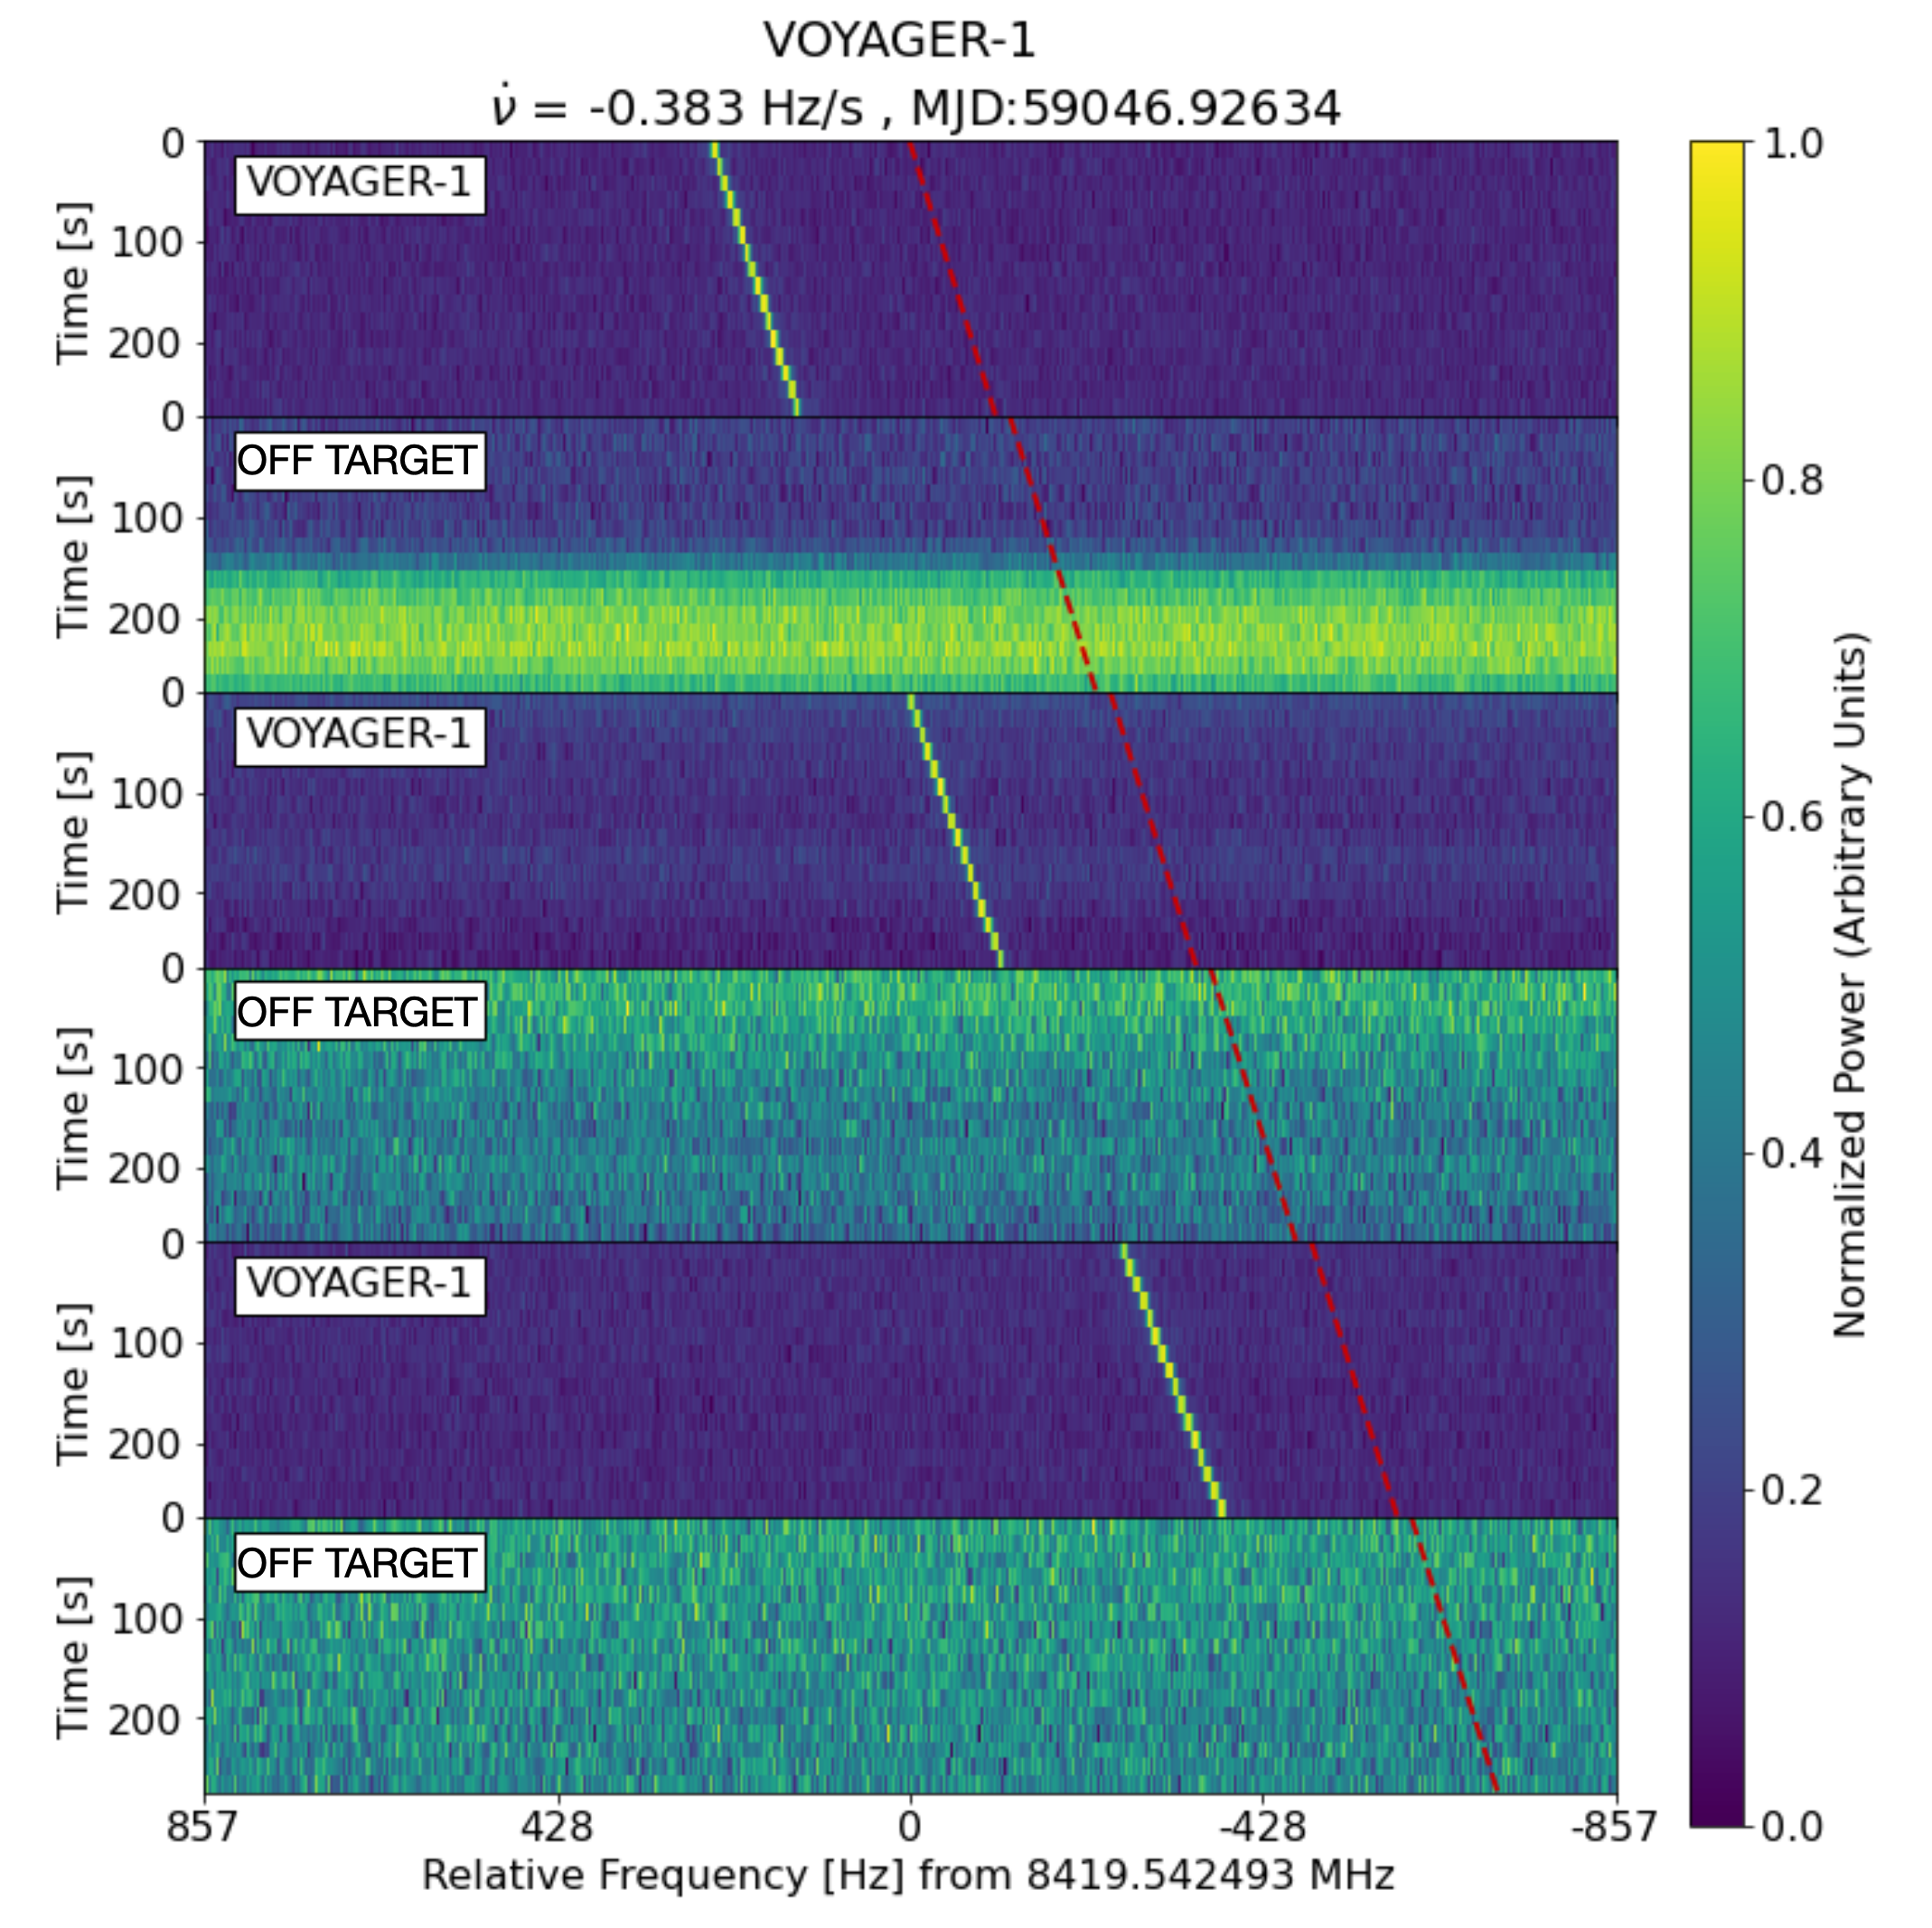\n\nThese searches use the fine frequency resolution data product (one of the three different resolution spectrograms discussed above). One of the other versions of the same underlying data has a few hundred thousand frequency channels, and 273 time steps. This is the one that we used as the basis for the Kaggle competition, in order to be able to give you arrays of data that were approximately square, and more amenable to image processing algorithms than snippets extracted from the data product with only 16 time steps. Yuhong extracted regions of the mid-resolution files corresponding to 256 frequency channels, or about 700 kHz out of the overall ~1 GHz wide band. This is what we call the \"cadence snippets\".\n\nYuhong then used setigen to add artificial signals into just the ON observations of some of these cadence snippets, mimicking what we would expect to see for an alien signal (or for a signal from a probe like Voyager 1 or Mars 2020). As we demonstrated with those spacecraft scans, the simple narrowband Doppler search with turboSETI is actually pretty good at finding interesting candidates. But turboSETI isn't great at finding signals in crowded regions of the spectrum with lots of human-generated radio frequency interference (from satellites, cellphones, and the like) or at finding signals that aren't neat diagonal lines. That's why we needed your help to build algorithms that perform better in these conditions.\n\nInjecting these signals into the data perturbs the statistics of the images, though, and we didn't want competitors to just be able to plot histograms of the images and immediately see which ones had signals in them. In itself, that would not be a bad technique to use for SETI (although it would result in more false positives than the Doppler drift search) but we were interested in exploring computer vision algorithms or other methods to isolate signals (and anomalies) in noisy backgrounds. So after the signal injection, we rescaled the data to match the histograms across a cadence. Hiding these needles (candidates) in the haystack of real data turned out to be pretty challenging to do without giving the game away, and as many of you know there were a couple of subtle data leaks that caught us out. We appreciated your patience as we regenerated the data. At the reboot, we also made the signals fainter, and added an additional signal type, because Kagglers had been doing *too* well on the initial problem, even before the data leak!\n\nThe main issue that we faced when setting up this challenge is that we don't have any real examples of ET signals. We do know qualitatively how we would expect such signals to appear in our data, but building generalized anomaly detection algorithms to find them isn't easy. Your submissions have given us several promising new avenues for doing so, though.\n\nIt's going to take us a while to digest the results and figure out how we can best apply them to our real-world signal detection problem, and we could use your help. Feel free to reach out to me personally (scroft@berkeleyDELETE_THIS_STRING_IF_YOU_ARE_NOT_A_ROBOT.edu - subject: Kaggle) if you'd like to be added to our Slack workspace, if you'd be interested in participating in a Zoom call about some of our data analysis challenges, or if you have some time to volunteer to work with us. We have several folks from the tech industry collaborating with us at the moment and we'd welcome additional machine learning expertise to help us advance our signal processing abilities.\n\nYou can also check out some more of our tutorial materials and code on github - a good place to start is https://github.com/UCBerkeleySETI/breakthrough/blob/master/GBT/README.md - read our blog at http://seti.berkeley.edu/blog , and follow us on [Facebook](https://www.facebook.com/berkeleyseti), [Twitter](https://twitter.com/berkeleyseti), [Instagram](https://instagram.com/berkeleyseti), and [YouTube](https://youtube.com/berkeleyseti).\n\nThanks again for all of your efforts and we appreciate your help in pushing forward our capabilities as we attempt to answer one of the most profound questions in science: Are we alone?", "votes": 22 }, { "id": 1504412, "postDate": "2021-09-06T10:57:01.267Z", "content": "Thanks for sharing.
\nHave you understood how you could have overlapping images with and without signal? It seems you added signal after cropping while it should have been added before cropping IMHO.
", "rawMarkdown": "Thanks for sharing.\n\nHave you understood how you could have overlapping images with and without signal? It seems you added signal after cropping while it should have been added before cropping IMHO.", "votes": 2 } ], "comments": [ { "id": 1504412, "author_name": "CPMP", "author_url": "", "post_date": "2021-09-06T10:57:01.267000", "content": "Thanks for sharing.
\nHave you understood how you could have overlapping images with and without signal? It seems you added signal after cropping while it should have been added before cropping IMHO.
", "votes": 2, "replies": [] } ], "raw_markdown_by_id": { "1497077": "On behalf of the Breakthrough Listen team, I'd like to thank all of the competitors for their fantastic efforts in this competition. I'd also like to thank the team at Kaggle for their superb support during the time it took to put this competition together, and I'd like to extend my particular gratitude to our amazing undergraduate intern, Yuhong Chen, who was instrumental in putting together the dataset for this challenge. We want to encourage you to stay connected with us on this important work. See below for opportunities to continue your contributions to our search. \n\nI'd like to tell you a bit more about the Kaggle dataset [than we did at the start of the competition](https://www.kaggle.com/c/seti-breakthrough-listen/overview/data-information). Since we don't have any real examples of ET signals (yet!) we turned to [setigen](https://github.com/bbrzycki/setigen) - as some of you figured out - to inject our \"needle\" signals into real data from the Green Bank Telescope. The individual spectrogram files (containing detected power as a function of frequency and time) from GBT can be tens of GB in size. Each represents a five minute scan on a target, typically as part of a cadence of three \"ON\" scans interspersed with three \"OFF\" scans. We generate three versions of each of the six scans in a cadence, by passing the raw data from GBT (which are tens of times larger still than the spectrograms) through three different Fourier transforms. This gives us different combinations of time and frequency resolution, as described in [this paper](https://arxiv.org/pdf/1906.07391.pdf). The data product that we typically use for SETI analyses (e.g. https://arxiv.org/pdf/2101.11137.pdf) consists of hundreds of millions of frequency channels, and just 16 time steps. We normally run this through custom code called [\"turboSETI\"](https://github.com/UCBerkeleySETI/turbo_seti) which searches for narrowband Doppler drifting signals (essentially diagonal lines in the spectrograms).\n\nIf you'd like to try running some of our data through turboSETI, Elan Lavie, a high school teacher working with us last summer, analyzed some observations of Voyager 1, [which we can detect](https://github.com/elanlavie/VoyagerTutorialRepository/blob/master/VoyagerTutorial.ipynb) using the existing algorithms in a blind search, even though it's 20 billion kilometers from Earth. And one of our undergraduate students, Ellie White, put together [a Kaggle notebook](https://www.kaggle.com/elliewhite/breakthrough-listen-mars-tutorial) that does a similar search for the Mars2020 spacecraft, as it was en route to Mars earlier this year.\n\n\n\nThese searches use the fine frequency resolution data product (one of the three different resolution spectrograms discussed above). One of the other versions of the same underlying data has a few hundred thousand frequency channels, and 273 time steps. This is the one that we used as the basis for the Kaggle competition, in order to be able to give you arrays of data that were approximately square, and more amenable to image processing algorithms than snippets extracted from the data product with only 16 time steps. Yuhong extracted regions of the mid-resolution files corresponding to 256 frequency channels, or about 700 kHz out of the overall ~1 GHz wide band. This is what we call the \"cadence snippets\".\n\nYuhong then used setigen to add artificial signals into just the ON observations of some of these cadence snippets, mimicking what we would expect to see for an alien signal (or for a signal from a probe like Voyager 1 or Mars 2020). As we demonstrated with those spacecraft scans, the simple narrowband Doppler search with turboSETI is actually pretty good at finding interesting candidates. But turboSETI isn't great at finding signals in crowded regions of the spectrum with lots of human-generated radio frequency interference (from satellites, cellphones, and the like) or at finding signals that aren't neat diagonal lines. That's why we needed your help to build algorithms that perform better in these conditions.\n\nInjecting these signals into the data perturbs the statistics of the images, though, and we didn't want competitors to just be able to plot histograms of the images and immediately see which ones had signals in them. In itself, that would not be a bad technique to use for SETI (although it would result in more false positives than the Doppler drift search) but we were interested in exploring computer vision algorithms or other methods to isolate signals (and anomalies) in noisy backgrounds. So after the signal injection, we rescaled the data to match the histograms across a cadence. Hiding these needles (candidates) in the haystack of real data turned out to be pretty challenging to do without giving the game away, and as many of you know there were a couple of subtle data leaks that caught us out. We appreciated your patience as we regenerated the data. At the reboot, we also made the signals fainter, and added an additional signal type, because Kagglers had been doing *too* well on the initial problem, even before the data leak!\n\nThe main issue that we faced when setting up this challenge is that we don't have any real examples of ET signals. We do know qualitatively how we would expect such signals to appear in our data, but building generalized anomaly detection algorithms to find them isn't easy. Your submissions have given us several promising new avenues for doing so, though.\n\nIt's going to take us a while to digest the results and figure out how we can best apply them to our real-world signal detection problem, and we could use your help. Feel free to reach out to me personally (scroft@berkeleyDELETE_THIS_STRING_IF_YOU_ARE_NOT_A_ROBOT.edu - subject: Kaggle) if you'd like to be added to our Slack workspace, if you'd be interested in participating in a Zoom call about some of our data analysis challenges, or if you have some time to volunteer to work with us. We have several folks from the tech industry collaborating with us at the moment and we'd welcome additional machine learning expertise to help us advance our signal processing abilities.\n\nYou can also check out some more of our tutorial materials and code on github - a good place to start is https://github.com/UCBerkeleySETI/breakthrough/blob/master/GBT/README.md - read our blog at http://seti.berkeley.edu/blog , and follow us on [Facebook](https://www.facebook.com/berkeleyseti), [Twitter](https://twitter.com/berkeleyseti), [Instagram](https://instagram.com/berkeleyseti), and [YouTube](https://youtube.com/berkeleyseti).\n\nThanks again for all of your efforts and we appreciate your help in pushing forward our capabilities as we attempt to answer one of the most profound questions in science: Are we alone?", "1504412": "Thanks for sharing.\n\nHave you understood how you could have overlapping images with and without signal? It seems you added signal after cropping while it should have been added before cropping IMHO." } }