
First and foremost, we would like to express our deepest gratitude to Kaggle and the competition organizers for providing this wonderful opportunity. We also thank all the participants for making this competition engaging and insightful.
\nWe constructed a general two-stage pipeline:
\n
We will explain each process in detail below.
\nThe responsibility of Stage 1 is to extract the information necessary for estimating disease severity from the input data.
\nWe built a CenterNet-based 2D keypoint detector using EfficientNetB6 as the backbone and FPN as the neck. By inputting sagittal images near the center of the body, we estimate the coordinates of each disc level. For training data, we used sagittal images from RSNA2024 that have coordinates of Spinal Canal Stenosis at all levels, as well as the Coordinate Pretraining Dataset. By using the trained model to generate pseudo-labels on unused RSNA2024 data, we ultimately utilized all RSNA2024 data. Recognizing from several discussions that label noise existed, we manually reviewed all annotations and corrected erroneous labels by hand.
\nWe cropped the sagittal images at each disc level. To ensure diversity in the input data, we adopted multiple cropping settings. There was almost no difference in accuracy due to cropping settings.
\n
Using the output of the Disc Level Keypoint Detector, we assign arbitrary disc levels to the axial slices. The processing flow is as follows:
\nWe constructed a CenterNet-based 2D keypoint detector using EfficientNetB4 as the backbone and FPN as the neck. By inputting axial images, we estimate the coordinates of the spinal canal. Since the Y-coordinate can be accurately estimated from the results of the Disc Level Keypoint Detector but estimating the X-coordinate is challenging, we introduced this detector. For training data, we used axial images from RSNA2024 that have coordinates of Spinal Canal Stenosis.
\nUsing the output from the Spinal Canal Keypoint Detector, we crop the necessary regions centered on the spinal canal. To ensure diversity in the input data, we cropped at multiple sizes. There was almost no difference in accuracy due to cropping methods.
\n
The responsibility of Stage 2 is to estimate the severity of each condition using the outputs from Stage 1.
\nWe created a classification model to estimate the severity of Spinal Canal Stenosis from sagittal T1, sagittal T2/STIR, and axial T2 images. For sagittal T1 and sagittal T2/STIR, we input 15 slices at equal intervals into an encoder to generate feature representations for each slice. For axial T2, we input 10 slices at equal intervals. These slice features are then input into an attention mechanism to learn the relationships between slices. To ensure model diversity, we created two models with different head structures. To improve accuracy, we used auxiliary losses such as the severity of other conditions and slice-level predictions. Additionally, increasing the loss weight for the Severe class, due to the metric specifications, was effective. Test-time augmentation (TTA) by flipping axial images also improved the leaderboard score.
\n
After verifying various patterns of input-output combinations for the model, we found that the most effective approach was to input groups of sagittal T1, sagittal T2, and axial T2 slices at arbitrary disc levels to estimate the severity of Spinal Canal Stenosis. During training, we treated each group of slices as an independent data point without depending on the disc level. In other words, the model is designed to consistently learn the characteristics of Spinal Canal Stenosis from slice groups at any disc level and predict the severity based on those features, without specializing in any specific disc level. This allowed us to secure five times the amount of data per condition, which we believe contributed to the improvement in accuracy.
\nWe used the following encoders:
\nThe basic training settings are as follows:
\nlr=0.000025, OneCycleLR scheduler (Warmup for 3/10 steps of the total)[1.0, 2.0, 4.0]drop_path_rate = 0.2 or 0.3RandomBrightnessContrastBlurDistortionShiftScaleRotateCoarseDropoutMixup (Optional)We designed preprocessing steps for training and inference of the Side Classifier. We split the sagittal and axial images into the left and right sides of the body. For the right-side data, we reversed the order of sagittal slices and horizontally flipped the axial images. This allowed us to handle the left and right sides uniformly and effectively doubled the amount of data available for training.
\nWe created a classification model to estimate the severity of Neural Foraminal Narrowing and Subarticular Stenosis from sagittal T1, sagittal T2/STIR, and axial T2 images. The model structure and the number of input slices are identical to those of the Center Classifier.
\nAfter verifying various patterns of input-output combinations for the model, we found that the most effective approach was to input groups of sagittal T1, sagittal T2, and axial T2 slices at arbitrary disc levels and arbitrary sides (left or right) to estimate the severity of Neural Foraminal Narrowing and Subarticular Stenosis. By applying the Split LR preprocessing and flipping the right-side images to increase data, prediction accuracy improved. During training, we treated each group of slices as an independent data point without distinguishing disc levels or sides of the body. In other words, the model is designed to learn the characteristics of these conditions from the input slice groups, regardless of disc level or side, and estimate the severity based on those features. This allowed us to secure ten times the amount of data per condition, which we believe contributed to the improvement in accuracy.
\ny: Number of moderate or higher severity cases included in one studygroups: study_idFor items without ground truth labels, we used the predictions of the trained model as soft labels. The change in accuracy due to the presence or absence of pseudo-labels was not significant, but we introduced the use of pseudo-labels as an option to ensure model diversity.
\nThe highest CV score for a single model was 0.3858, achieved by combining the Center Classifier (Type B) ConvNeXt-T and the Side Classifier (Type B) ConvNeXt-N.
\nThe ensemble CV score was 0.3643, obtained by simply averaging 30 models (15 Center models and 15 Side models) with diversity in input image types, model architectures, data augmentations, auxiliary losses, pseudo-labels, etc.
\nWe applied Temperature Scaling with a temperature of 0.91 to the logits of Spinal Canal Stenosis, sharpening the predicted probabilities.
\n
https://github.com/Moyasii/Kaggle-2024-RSNA-Pub
\nhttps://www.youtube.com/watch?v=e2uRj5f9Lms&ab_channel=sugupoko
", "messages": [ { "id": "3012379", "postDate": "10/09/2024 01:47:44", "content": "First and foremost, we would like to express our deepest gratitude to Kaggle and the competition organizers for providing this wonderful opportunity. We also thank all the participants for making this competition engaging and insightful.
\nWe constructed a general two-stage pipeline:
\n
We will explain each process in detail below.
\nThe responsibility of Stage 1 is to extract the information necessary for estimating disease severity from the input data.
\nWe built a CenterNet-based 2D keypoint detector using EfficientNetB6 as the backbone and FPN as the neck. By inputting sagittal images near the center of the body, we estimate the coordinates of each disc level. For training data, we used sagittal images from RSNA2024 that have coordinates of Spinal Canal Stenosis at all levels, as well as the Coordinate Pretraining Dataset. By using the trained model to generate pseudo-labels on unused RSNA2024 data, we ultimately utilized all RSNA2024 data. Recognizing from several discussions that label noise existed, we manually reviewed all annotations and corrected erroneous labels by hand.
\nWe cropped the sagittal images at each disc level. To ensure diversity in the input data, we adopted multiple cropping settings. There was almost no difference in accuracy due to cropping settings.
\n
Using the output of the Disc Level Keypoint Detector, we assign arbitrary disc levels to the axial slices. The processing flow is as follows:
\nWe constructed a CenterNet-based 2D keypoint detector using EfficientNetB4 as the backbone and FPN as the neck. By inputting axial images, we estimate the coordinates of the spinal canal. Since the Y-coordinate can be accurately estimated from the results of the Disc Level Keypoint Detector but estimating the X-coordinate is challenging, we introduced this detector. For training data, we used axial images from RSNA2024 that have coordinates of Spinal Canal Stenosis.
\nUsing the output from the Spinal Canal Keypoint Detector, we crop the necessary regions centered on the spinal canal. To ensure diversity in the input data, we cropped at multiple sizes. There was almost no difference in accuracy due to cropping methods.
\n
The responsibility of Stage 2 is to estimate the severity of each condition using the outputs from Stage 1.
\nWe created a classification model to estimate the severity of Spinal Canal Stenosis from sagittal T1, sagittal T2/STIR, and axial T2 images. For sagittal T1 and sagittal T2/STIR, we input 15 slices at equal intervals into an encoder to generate feature representations for each slice. For axial T2, we input 10 slices at equal intervals. These slice features are then input into an attention mechanism to learn the relationships between slices. To ensure model diversity, we created two models with different head structures. To improve accuracy, we used auxiliary losses such as the severity of other conditions and slice-level predictions. Additionally, increasing the loss weight for the Severe class, due to the metric specifications, was effective. Test-time augmentation (TTA) by flipping axial images also improved the leaderboard score.
\n
After verifying various patterns of input-output combinations for the model, we found that the most effective approach was to input groups of sagittal T1, sagittal T2, and axial T2 slices at arbitrary disc levels to estimate the severity of Spinal Canal Stenosis. During training, we treated each group of slices as an independent data point without depending on the disc level. In other words, the model is designed to consistently learn the characteristics of Spinal Canal Stenosis from slice groups at any disc level and predict the severity based on those features, without specializing in any specific disc level. This allowed us to secure five times the amount of data per condition, which we believe contributed to the improvement in accuracy.
\nWe used the following encoders:
\nThe basic training settings are as follows:
\nlr=0.000025, OneCycleLR scheduler (Warmup for 3/10 steps of the total)[1.0, 2.0, 4.0]drop_path_rate = 0.2 or 0.3RandomBrightnessContrastBlurDistortionShiftScaleRotateCoarseDropoutMixup (Optional)We designed preprocessing steps for training and inference of the Side Classifier. We split the sagittal and axial images into the left and right sides of the body. For the right-side data, we reversed the order of sagittal slices and horizontally flipped the axial images. This allowed us to handle the left and right sides uniformly and effectively doubled the amount of data available for training.
\nWe created a classification model to estimate the severity of Neural Foraminal Narrowing and Subarticular Stenosis from sagittal T1, sagittal T2/STIR, and axial T2 images. The model structure and the number of input slices are identical to those of the Center Classifier.
\nAfter verifying various patterns of input-output combinations for the model, we found that the most effective approach was to input groups of sagittal T1, sagittal T2, and axial T2 slices at arbitrary disc levels and arbitrary sides (left or right) to estimate the severity of Neural Foraminal Narrowing and Subarticular Stenosis. By applying the Split LR preprocessing and flipping the right-side images to increase data, prediction accuracy improved. During training, we treated each group of slices as an independent data point without distinguishing disc levels or sides of the body. In other words, the model is designed to learn the characteristics of these conditions from the input slice groups, regardless of disc level or side, and estimate the severity based on those features. This allowed us to secure ten times the amount of data per condition, which we believe contributed to the improvement in accuracy.
\ny: Number of moderate or higher severity cases included in one studygroups: study_idFor items without ground truth labels, we used the predictions of the trained model as soft labels. The change in accuracy due to the presence or absence of pseudo-labels was not significant, but we introduced the use of pseudo-labels as an option to ensure model diversity.
\nThe highest CV score for a single model was 0.3858, achieved by combining the Center Classifier (Type B) ConvNeXt-T and the Side Classifier (Type B) ConvNeXt-N.
\nThe ensemble CV score was 0.3643, obtained by simply averaging 30 models (15 Center models and 15 Side models) with diversity in input image types, model architectures, data augmentations, auxiliary losses, pseudo-labels, etc.
\nWe applied Temperature Scaling with a temperature of 0.91 to the logits of Spinal Canal Stenosis, sharpening the predicted probabilities.
\n
https://github.com/Moyasii/Kaggle-2024-RSNA-Pub
\nhttps://www.youtube.com/watch?v=e2uRj5f9Lms&ab_channel=sugupoko
", "rawMarkdown": "# 3rd Place Solution\n\nFirst and foremost, we would like to express our deepest gratitude to Kaggle and the competition organizers for providing this wonderful opportunity. We also thank all the participants for making this competition engaging and insightful.\n\n## Summary\n\nWe constructed a general two-stage pipeline:\n\n- **Stage 1**: Crop sagittal images at each disc level and crop axial images using disc level assignments and spinal canal positions.\n- **Stage 2**: Use a **Center Classifier** to classify the severity of Spinal Canal Stenosis and a **Side Classifier** to classify the severity of Neural Foraminal Narrowing and Subarticular Stenosis.\n\n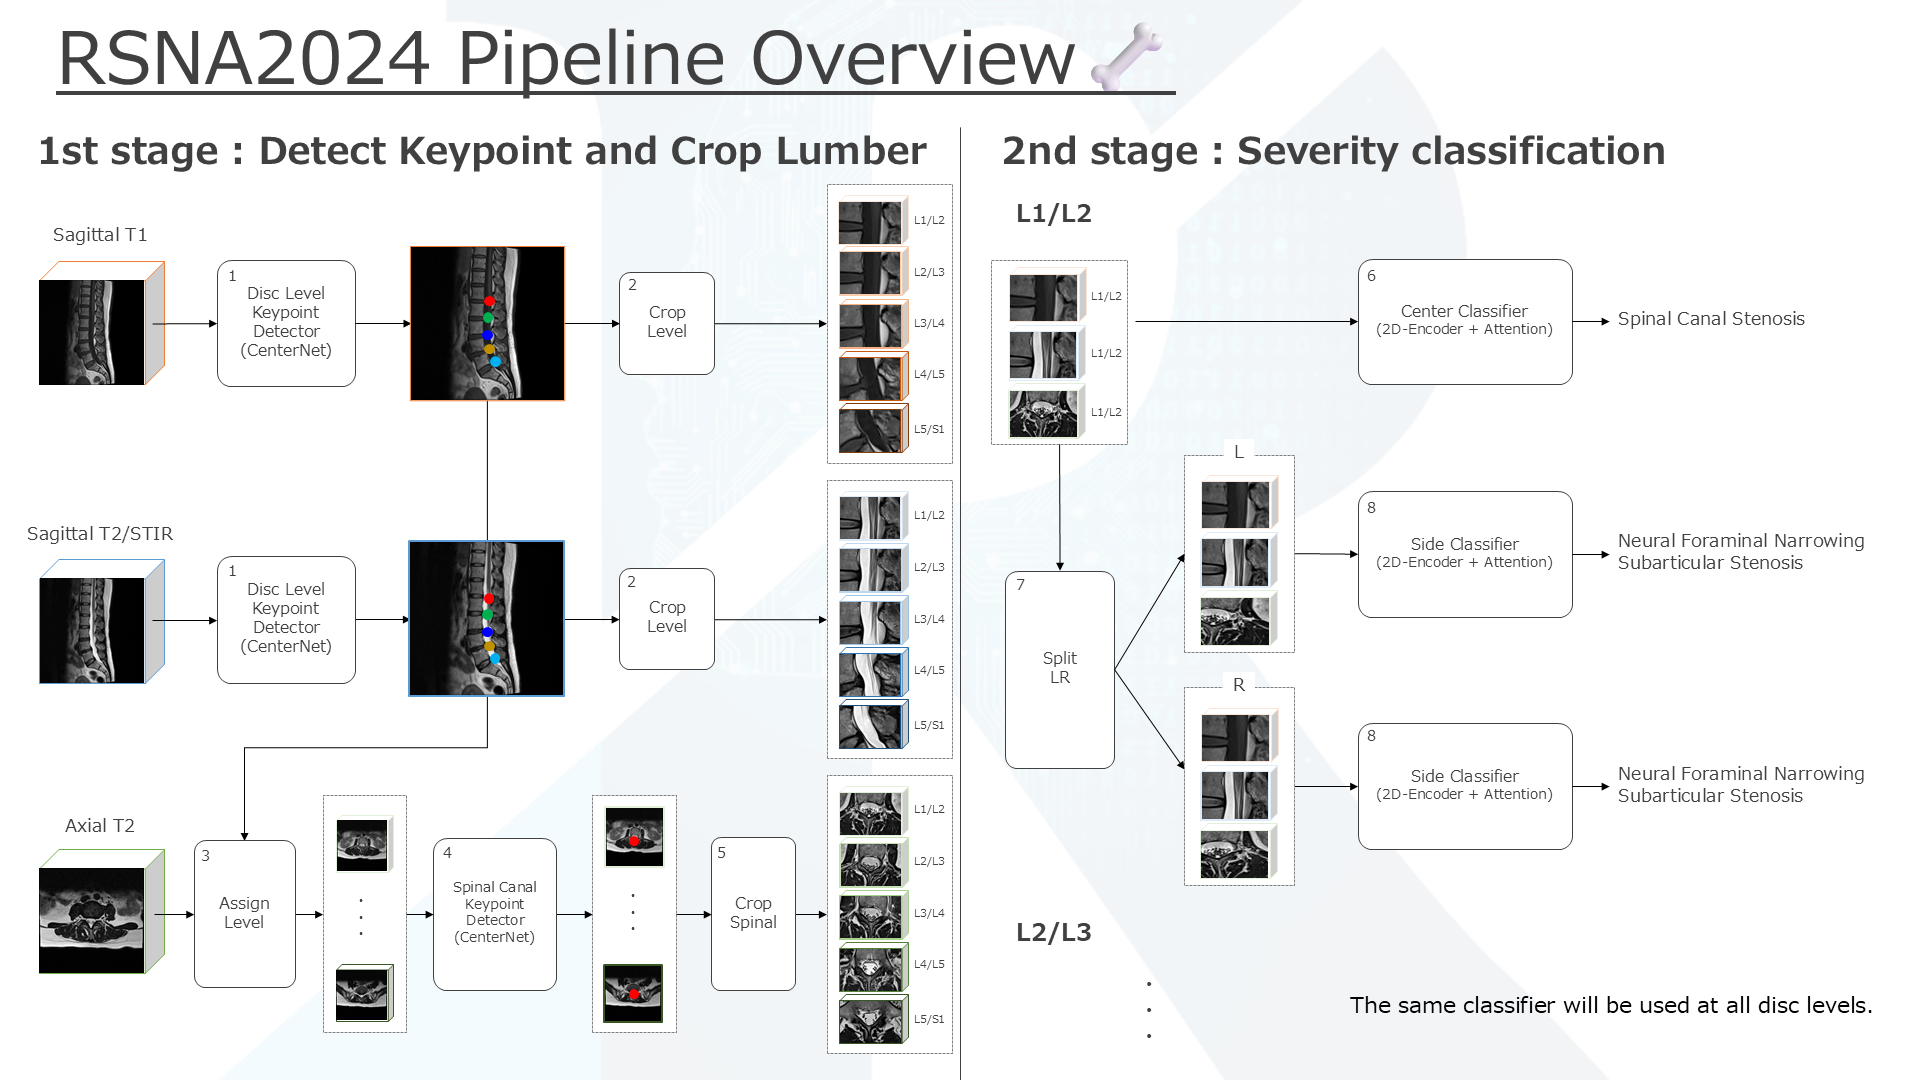\n\nWe will explain each process in detail below.\n\n## Stage 1\n\nThe responsibility of Stage 1 is to extract the information necessary for estimating disease severity from the input data.\n\n### 1. Disc Level Keypoint Detector (CenterNet)\n\nWe built a CenterNet-based 2D keypoint detector using EfficientNetB6 as the backbone and FPN as the neck. By inputting sagittal images near the center of the body, we estimate the coordinates of each disc level. For training data, we used sagittal images from RSNA2024 that have coordinates of Spinal Canal Stenosis at all levels, as well as the [Coordinate Pretraining Dataset](https://www.kaggle.com/competitions/rsna-2024-lumbar-spine-degenerative-classification/discussion/524500). By using the trained model to generate pseudo-labels on unused RSNA2024 data, we ultimately utilized all RSNA2024 data. Recognizing from several discussions that label noise existed, we manually reviewed all annotations and corrected erroneous labels by hand.\n\n### 2. Crop Level\n\nWe cropped the sagittal images at each disc level. To ensure diversity in the input data, we adopted multiple cropping settings. There was almost no difference in accuracy due to cropping settings.\n\n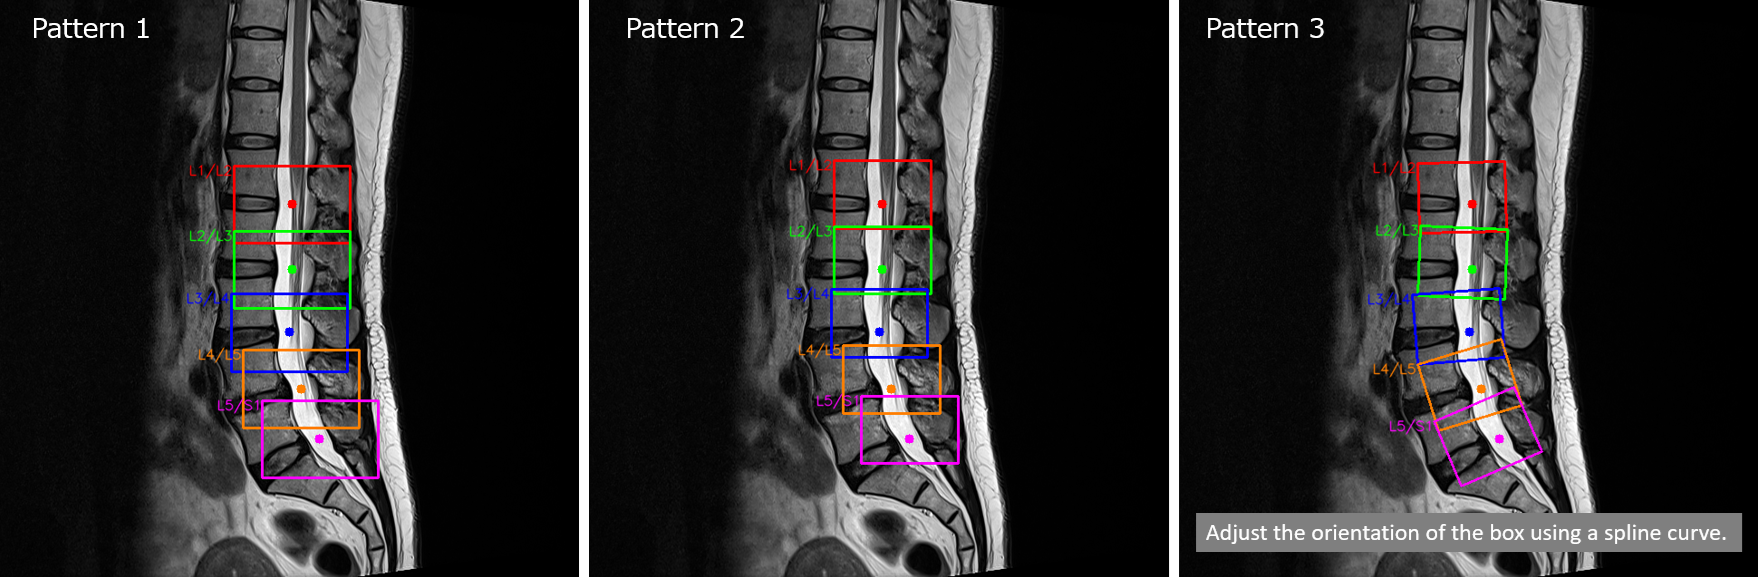\n\n### 3. Assign Level\n\nUsing the output of the Disc Level Keypoint Detector, we assign arbitrary disc levels to the axial slices. The processing flow is as follows:\n\n1. Convert the image coordinates of disc levels to real-world coordinates.\n2. Estimate the vertebral positions of L1, L2, ..., S1 from the midpoints of each disc level (e.g., L1/L2, L2/L3, etc.). Since we cannot obtain coordinates for T12/L1 and S1/S2, we pseudo-calculate the coordinates for L1 and S1.\n3. Calculate the intersection points between the line segments connecting adjacent vertebrae and the axial planes, and assign the corresponding disc levels.\n\n### 4. Spinal Canal Keypoint Detector (CenterNet)\n\nWe constructed a CenterNet-based 2D keypoint detector using EfficientNetB4 as the backbone and FPN as the neck. By inputting axial images, we estimate the coordinates of the spinal canal. Since the Y-coordinate can be accurately estimated from the results of the Disc Level Keypoint Detector but estimating the X-coordinate is challenging, we introduced this detector. For training data, we used axial images from RSNA2024 that have coordinates of Spinal Canal Stenosis.\n\n### 5. Crop Spinal\n\nUsing the output from the Spinal Canal Keypoint Detector, we crop the necessary regions centered on the spinal canal. To ensure diversity in the input data, we cropped at multiple sizes. There was almost no difference in accuracy due to cropping methods.\n\n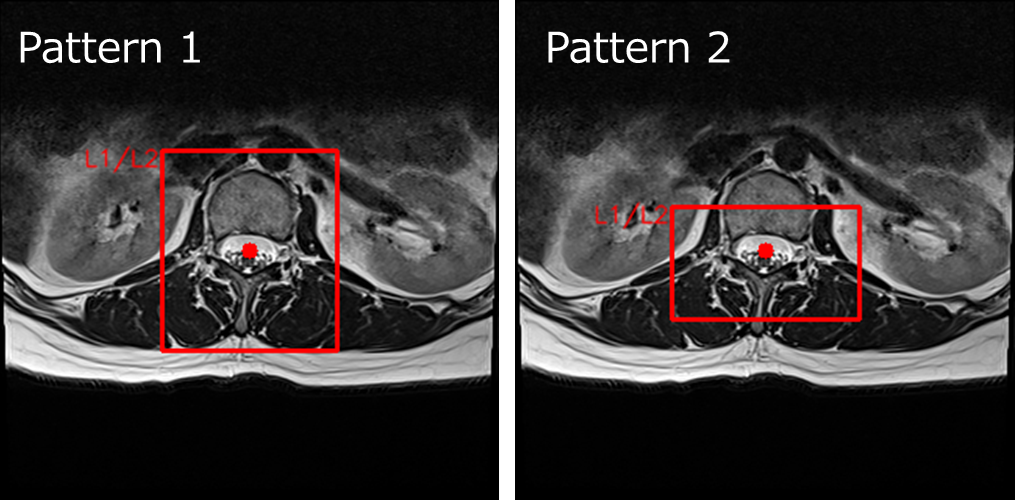\n\n## Stage 2\n\nThe responsibility of Stage 2 is to estimate the severity of each condition using the outputs from Stage 1.\n\n### 6. Center Classifier (2D-Encoder + Attention)\n\nWe created a classification model to estimate the severity of Spinal Canal Stenosis from sagittal T1, sagittal T2/STIR, and axial T2 images. For sagittal T1 and sagittal T2/STIR, we input 15 slices at equal intervals into an encoder to generate feature representations for each slice. For axial T2, we input 10 slices at equal intervals. These slice features are then input into an attention mechanism to learn the relationships between slices. To ensure model diversity, we created two models with different head structures. To improve accuracy, we used auxiliary losses such as the severity of other conditions and slice-level predictions. Additionally, increasing the loss weight for the Severe class, due to the metric specifications, was effective. Test-time augmentation (TTA) by flipping axial images also improved the leaderboard score.\n\n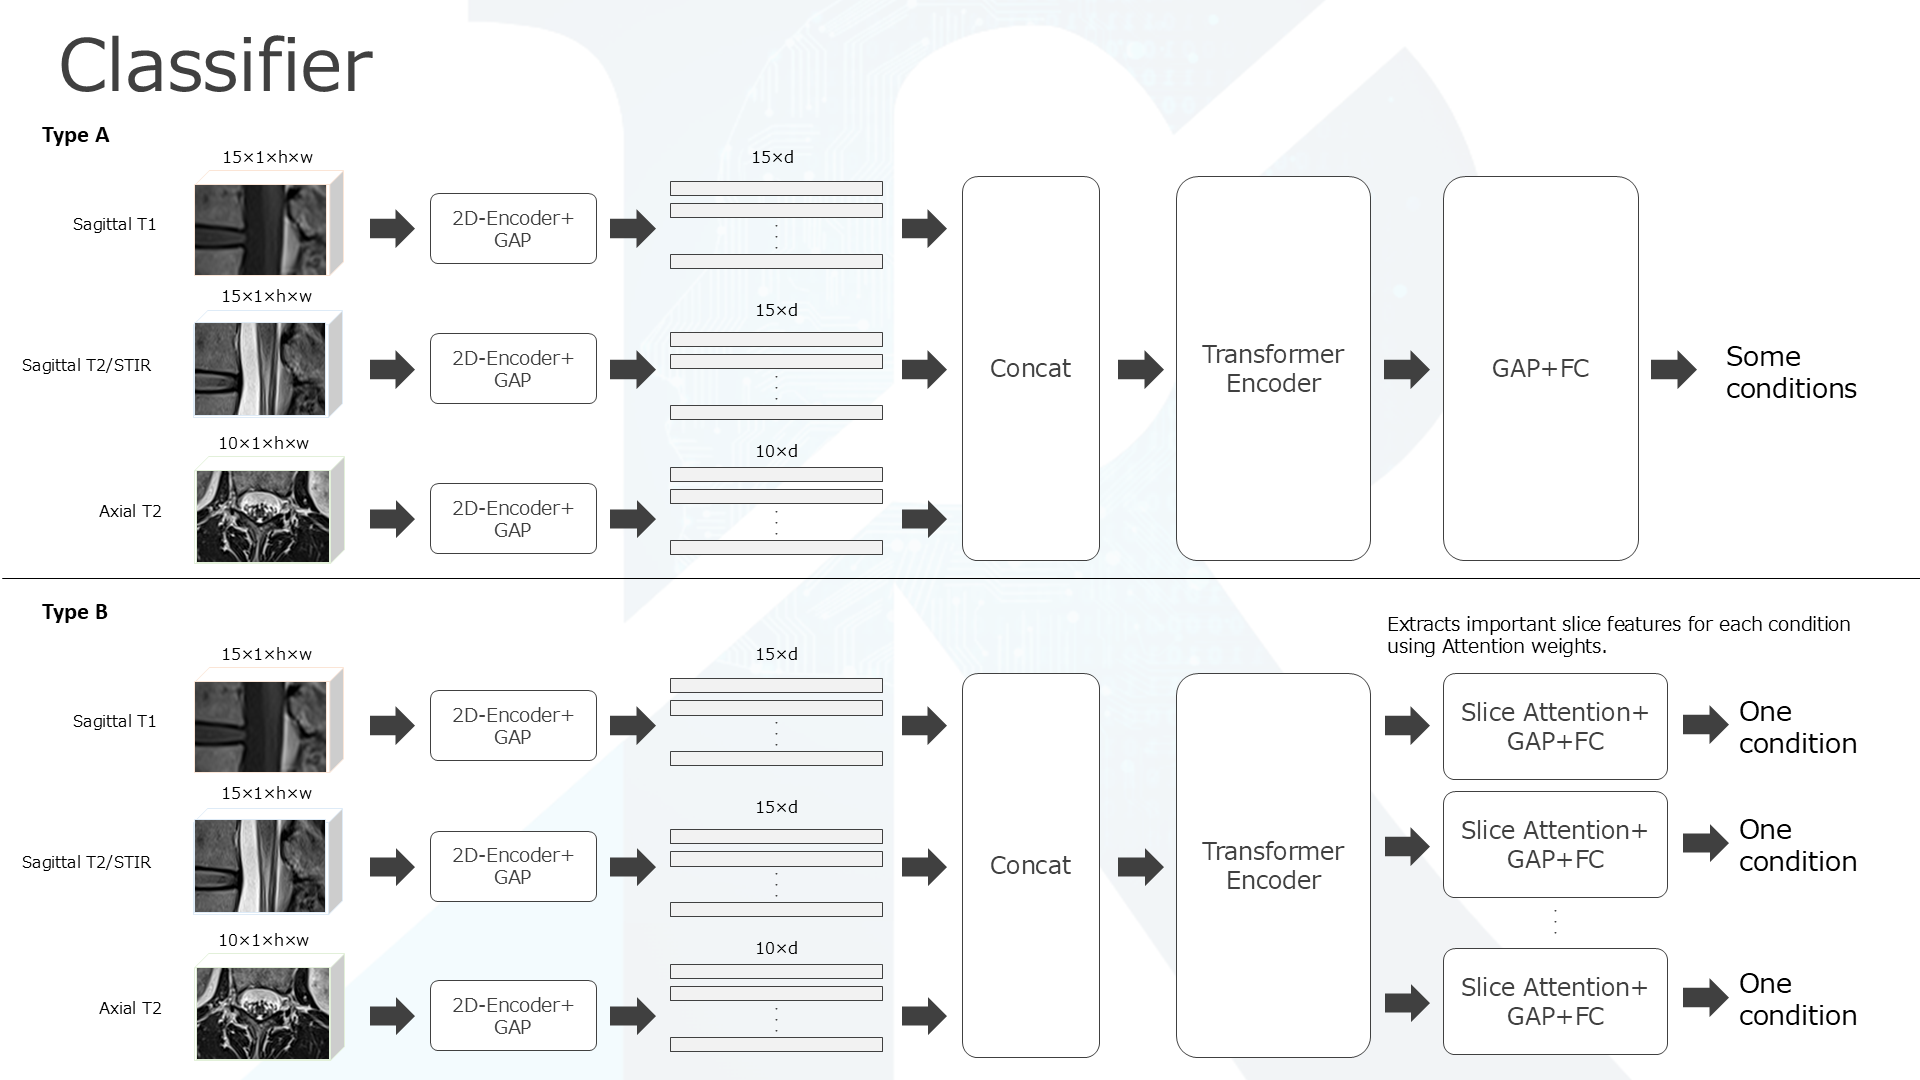\n\nAfter verifying various patterns of input-output combinations for the model, we found that the most effective approach was to input groups of sagittal T1, sagittal T2, and axial T2 slices at arbitrary disc levels to estimate the severity of Spinal Canal Stenosis. During training, we treated each group of slices as an independent data point without depending on the disc level. In other words, the model is designed to consistently learn the characteristics of Spinal Canal Stenosis from slice groups at any disc level and predict the severity based on those features, without specializing in any specific disc level. This allowed us to secure five times the amount of data per condition, which we believe contributed to the improvement in accuracy.\n\nWe used the following encoders:\n\n- ResNet18 (160x160, 224x224)\n- MNasNet-S (224x224)\n- EfficientNet-B4 (224x224)\n- EfficientNetV2-RW (224x224)\n- EfficientNetV2-S (224x224)\n- ConvNeXt-N (224x224, 320x320)\n- ConvNeXt-T (224x224, 320x320)\n- MaxViT-N (256x256)\n\n#### Training\n\nThe basic training settings are as follows:\n\n- 10–20 epochs\n- AdamW with learning rate `lr=0.000025`, OneCycleLR scheduler (Warmup for 3/10 steps of the total)\n- Batch size: 2–8\n- Cross-Entropy Weight: `[1.0, 2.0, 4.0]`\n- `drop_path_rate` = 0.2 or 0.3\n- Augmentations:\n - `RandomBrightnessContrast`\n - `Blur`\n - `Distortion`\n - `ShiftScaleRotate`\n - `CoarseDropout`\n - `Mixup` (Optional)\n\n### 7. Split LR\n\nWe designed preprocessing steps for training and inference of the Side Classifier. We split the sagittal and axial images into the left and right sides of the body. For the right-side data, we reversed the order of sagittal slices and horizontally flipped the axial images. This allowed us to handle the left and right sides uniformly and effectively doubled the amount of data available for training.\n\n### 8. Side Classifier (2D-Encoder + Attention)\n\nWe created a classification model to estimate the severity of Neural Foraminal Narrowing and Subarticular Stenosis from sagittal T1, sagittal T2/STIR, and axial T2 images. The model structure and the number of input slices are identical to those of the Center Classifier.\n\nAfter verifying various patterns of input-output combinations for the model, we found that the most effective approach was to input groups of sagittal T1, sagittal T2, and axial T2 slices at arbitrary disc levels and arbitrary sides (left or right) to estimate the severity of Neural Foraminal Narrowing and Subarticular Stenosis. By applying the Split LR preprocessing and flipping the right-side images to increase data, prediction accuracy improved. During training, we treated each group of slices as an independent data point without distinguishing disc levels or sides of the body. In other words, the model is designed to learn the characteristics of these conditions from the input slice groups, regardless of disc level or side, and estimate the severity based on those features. This allowed us to secure ten times the amount of data per condition, which we believe contributed to the improvement in accuracy.\n\n## Team Validation Strategy\n\n- **StratifiedKFold**\n - `y`: Number of moderate or higher severity cases included in one study\n - `groups`: `study_id`\n- Reference code: [Lumbar RSNA 2024 EDA + 3D Visualizationn](https://www.kaggle.com/code/artemtprv/lumbar-rsna-2024-eda-3d-visualization)\n\n## Pseudo Labeling\n\nFor items without ground truth labels, we used the predictions of the trained model as soft labels. The change in accuracy due to the presence or absence of pseudo-labels was not significant, but we introduced the use of pseudo-labels as an option to ensure model diversity.\n\n## Ensemble\n\nThe highest CV score for a single model was **0.3858**, achieved by combining the Center Classifier (Type B) ConvNeXt-T and the Side Classifier (Type B) ConvNeXt-N.\n\nThe ensemble CV score was **0.3643**, obtained by simply averaging 30 models (15 Center models and 15 Side models) with diversity in input image types, model architectures, data augmentations, auxiliary losses, pseudo-labels, etc.\n\n## Post-processing\n\nWe applied Temperature Scaling with a temperature of **0.91** to the logits of Spinal Canal Stenosis, sharpening the predicted probabilities.\n\n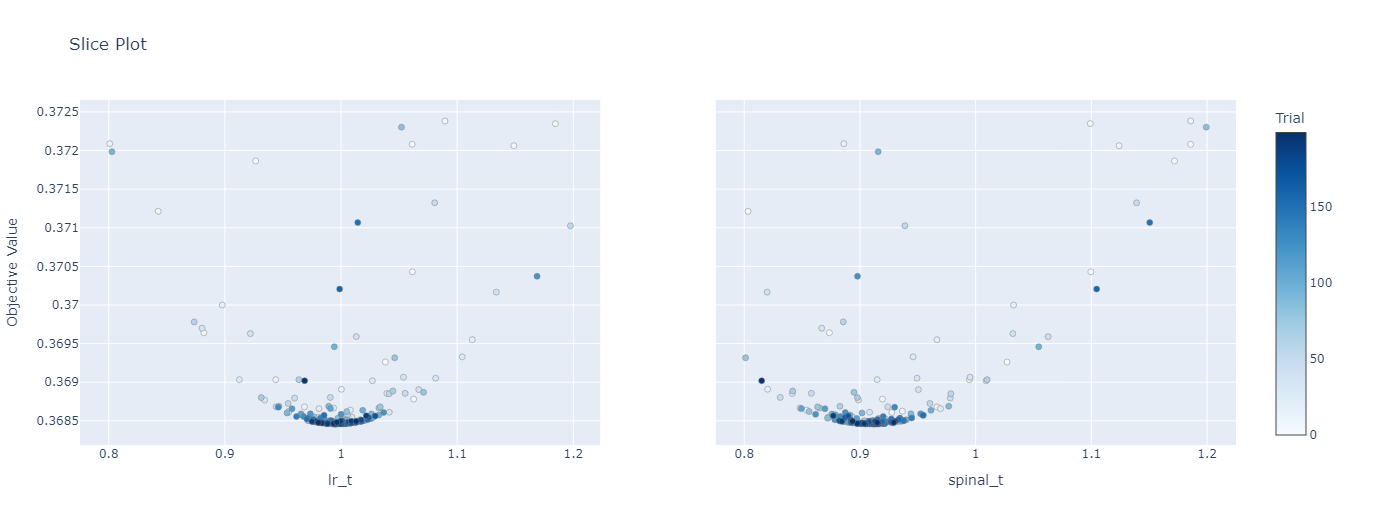\n\n## What Didn't Work\n\n- One-stage solution\n- Multi-level Multi-disease models\n- Multi-level Single-disease models\n- Models specialized for each disc level\n- Models specialized for each side of the body\n- 3D-CNN\n- 2.5D-CNN + Attention\n- 2D-CNN + LSTM\n- Focal Loss\n- Long epochs\n\n## Code (Updated on 2024-10-27)\n\nhttps://github.com/Moyasii/Kaggle-2024-RSNA-Pub\n\n## Video (Updated on 2024-10-28)\n\nhttps://www.youtube.com/watch?v=e2uRj5f9Lms&ab_channel=sugupoko", "votes": null }, { "id": "3012397", "postDate": "10/09/2024 02:21:41", "content": "Great explanations! Do you think that temperature scaling had a bigger impact because of the noise in the dataset or just because 🤔
", "rawMarkdown": "Great explanations! Do you think that temperature scaling had a bigger impact because of the noise in the dataset or just because 🤔", "votes": null }, { "id": "3012618", "postDate": "10/09/2024 08:09:39", "content": "Thank you for sharing your detailed solution. Congratulations, great work!
", "rawMarkdown": "Thank you for sharing your detailed solution. Congratulations, great work!", "votes": null }, { "id": "3013054", "postDate": "10/09/2024 16:02:58", "content": "Congratulations on winning the 3rd prize in this competition. Thanks for sharing the details of your solution with diagrams and images.
", "rawMarkdown": "Congratulations on winning the 3rd prize in this competition. Thanks for sharing the details of your solution with diagrams and images.", "votes": null }, { "id": "3013384", "postDate": "10/10/2024 02:58:17", "content": "Thanks for sharing and explaining your solution in depth, awesome work!
", "rawMarkdown": "Thanks for sharing and explaining your solution in depth, awesome work!", "votes": null }, { "id": "3014608", "postDate": "10/11/2024 12:15:32", "content": "Thanks for sharing and explaining your solution in depth, awesome work!
", "rawMarkdown": "Thanks for sharing and explaining your solution in depth, awesome work!", "votes": null }, { "id": "3014935", "postDate": "10/11/2024 18:10:05", "content": "Great explanations!
", "rawMarkdown": "Great explanations!", "votes": null }, { "id": "3020103", "postDate": "10/17/2024 06:53:58", "content": "Shocking! Thank you for this very detailed solution, which has made me realize the huge gap between me and the masters. I'm also looking forward to your code!!! I believe I can learn a lot from here.
", "rawMarkdown": "Shocking! Thank you for this very detailed solution, which has made me realize the huge gap between me and the masters. I'm also looking forward to your code!!! I believe I can learn a lot from here.", "votes": null }, { "id": "3021195", "postDate": "10/18/2024 08:52:22", "content": "Did you use DICOM format images, or did you switch to another format (like PNG)?\"
", "rawMarkdown": "Did you use DICOM format images, or did you switch to another format (like PNG)?\"", "votes": null }, { "id": "3024953", "postDate": "10/22/2024 07:33:38", "content": "Any updates on the code?
", "rawMarkdown": "Any updates on the code?", "votes": null } ], "comments": [ { "id": 3012397, "author_name": "sugupoko", "author_url": "", "post_date": "10/09/2024 02:21:41", "content": "Great explanations! Do you think that temperature scaling had a bigger impact because of the noise in the dataset or just because 🤔
", "votes": null, "replies": [] }, { "id": 3012618, "author_name": "marek3000", "author_url": "", "post_date": "10/09/2024 08:09:39", "content": "Thank you for sharing your detailed solution. Congratulations, great work!
", "votes": null, "replies": [] }, { "id": 3013054, "author_name": "crsuthikshnkumar", "author_url": "", "post_date": "10/09/2024 16:02:58", "content": "Congratulations on winning the 3rd prize in this competition. Thanks for sharing the details of your solution with diagrams and images.
", "votes": null, "replies": [] }, { "id": 3013384, "author_name": "ajpath", "author_url": "", "post_date": "10/10/2024 02:58:17", "content": "Thanks for sharing and explaining your solution in depth, awesome work!
", "votes": null, "replies": [] }, { "id": 3014608, "author_name": "mrsimple07", "author_url": "", "post_date": "10/11/2024 12:15:32", "content": "Thanks for sharing and explaining your solution in depth, awesome work!
", "votes": null, "replies": [] }, { "id": 3014935, "author_name": "humayrakhanomrime", "author_url": "", "post_date": "10/11/2024 18:10:05", "content": "Great explanations!
", "votes": null, "replies": [] }, { "id": 3020103, "author_name": "switch9527", "author_url": "", "post_date": "10/17/2024 06:53:58", "content": "Shocking! Thank you for this very detailed solution, which has made me realize the huge gap between me and the masters. I'm also looking forward to your code!!! I believe I can learn a lot from here.
", "votes": null, "replies": [] }, { "id": 3021195, "author_name": "danielpopov", "author_url": "", "post_date": "10/18/2024 08:52:22", "content": "Did you use DICOM format images, or did you switch to another format (like PNG)?\"
", "votes": null, "replies": [] }, { "id": 3024953, "author_name": "lordpatil", "author_url": "", "post_date": "10/22/2024 07:33:38", "content": "Any updates on the code?
", "votes": null, "replies": [] } ], "raw_markdown_by_id": { "3012379": "# 3rd Place Solution\n\nFirst and foremost, we would like to express our deepest gratitude to Kaggle and the competition organizers for providing this wonderful opportunity. We also thank all the participants for making this competition engaging and insightful.\n\n## Summary\n\nWe constructed a general two-stage pipeline:\n\n- **Stage 1**: Crop sagittal images at each disc level and crop axial images using disc level assignments and spinal canal positions.\n- **Stage 2**: Use a **Center Classifier** to classify the severity of Spinal Canal Stenosis and a **Side Classifier** to classify the severity of Neural Foraminal Narrowing and Subarticular Stenosis.\n\n\n\nWe will explain each process in detail below.\n\n## Stage 1\n\nThe responsibility of Stage 1 is to extract the information necessary for estimating disease severity from the input data.\n\n### 1. Disc Level Keypoint Detector (CenterNet)\n\nWe built a CenterNet-based 2D keypoint detector using EfficientNetB6 as the backbone and FPN as the neck. By inputting sagittal images near the center of the body, we estimate the coordinates of each disc level. For training data, we used sagittal images from RSNA2024 that have coordinates of Spinal Canal Stenosis at all levels, as well as the [Coordinate Pretraining Dataset](https://www.kaggle.com/competitions/rsna-2024-lumbar-spine-degenerative-classification/discussion/524500). By using the trained model to generate pseudo-labels on unused RSNA2024 data, we ultimately utilized all RSNA2024 data. Recognizing from several discussions that label noise existed, we manually reviewed all annotations and corrected erroneous labels by hand.\n\n### 2. Crop Level\n\nWe cropped the sagittal images at each disc level. To ensure diversity in the input data, we adopted multiple cropping settings. There was almost no difference in accuracy due to cropping settings.\n\n\n\n### 3. Assign Level\n\nUsing the output of the Disc Level Keypoint Detector, we assign arbitrary disc levels to the axial slices. The processing flow is as follows:\n\n1. Convert the image coordinates of disc levels to real-world coordinates.\n2. Estimate the vertebral positions of L1, L2, ..., S1 from the midpoints of each disc level (e.g., L1/L2, L2/L3, etc.). Since we cannot obtain coordinates for T12/L1 and S1/S2, we pseudo-calculate the coordinates for L1 and S1.\n3. Calculate the intersection points between the line segments connecting adjacent vertebrae and the axial planes, and assign the corresponding disc levels.\n\n### 4. Spinal Canal Keypoint Detector (CenterNet)\n\nWe constructed a CenterNet-based 2D keypoint detector using EfficientNetB4 as the backbone and FPN as the neck. By inputting axial images, we estimate the coordinates of the spinal canal. Since the Y-coordinate can be accurately estimated from the results of the Disc Level Keypoint Detector but estimating the X-coordinate is challenging, we introduced this detector. For training data, we used axial images from RSNA2024 that have coordinates of Spinal Canal Stenosis.\n\n### 5. Crop Spinal\n\nUsing the output from the Spinal Canal Keypoint Detector, we crop the necessary regions centered on the spinal canal. To ensure diversity in the input data, we cropped at multiple sizes. There was almost no difference in accuracy due to cropping methods.\n\n\n\n## Stage 2\n\nThe responsibility of Stage 2 is to estimate the severity of each condition using the outputs from Stage 1.\n\n### 6. Center Classifier (2D-Encoder + Attention)\n\nWe created a classification model to estimate the severity of Spinal Canal Stenosis from sagittal T1, sagittal T2/STIR, and axial T2 images. For sagittal T1 and sagittal T2/STIR, we input 15 slices at equal intervals into an encoder to generate feature representations for each slice. For axial T2, we input 10 slices at equal intervals. These slice features are then input into an attention mechanism to learn the relationships between slices. To ensure model diversity, we created two models with different head structures. To improve accuracy, we used auxiliary losses such as the severity of other conditions and slice-level predictions. Additionally, increasing the loss weight for the Severe class, due to the metric specifications, was effective. Test-time augmentation (TTA) by flipping axial images also improved the leaderboard score.\n\n\n\nAfter verifying various patterns of input-output combinations for the model, we found that the most effective approach was to input groups of sagittal T1, sagittal T2, and axial T2 slices at arbitrary disc levels to estimate the severity of Spinal Canal Stenosis. During training, we treated each group of slices as an independent data point without depending on the disc level. In other words, the model is designed to consistently learn the characteristics of Spinal Canal Stenosis from slice groups at any disc level and predict the severity based on those features, without specializing in any specific disc level. This allowed us to secure five times the amount of data per condition, which we believe contributed to the improvement in accuracy.\n\nWe used the following encoders:\n\n- ResNet18 (160x160, 224x224)\n- MNasNet-S (224x224)\n- EfficientNet-B4 (224x224)\n- EfficientNetV2-RW (224x224)\n- EfficientNetV2-S (224x224)\n- ConvNeXt-N (224x224, 320x320)\n- ConvNeXt-T (224x224, 320x320)\n- MaxViT-N (256x256)\n\n#### Training\n\nThe basic training settings are as follows:\n\n- 10–20 epochs\n- AdamW with learning rate `lr=0.000025`, OneCycleLR scheduler (Warmup for 3/10 steps of the total)\n- Batch size: 2–8\n- Cross-Entropy Weight: `[1.0, 2.0, 4.0]`\n- `drop_path_rate` = 0.2 or 0.3\n- Augmentations:\n - `RandomBrightnessContrast`\n - `Blur`\n - `Distortion`\n - `ShiftScaleRotate`\n - `CoarseDropout`\n - `Mixup` (Optional)\n\n### 7. Split LR\n\nWe designed preprocessing steps for training and inference of the Side Classifier. We split the sagittal and axial images into the left and right sides of the body. For the right-side data, we reversed the order of sagittal slices and horizontally flipped the axial images. This allowed us to handle the left and right sides uniformly and effectively doubled the amount of data available for training.\n\n### 8. Side Classifier (2D-Encoder + Attention)\n\nWe created a classification model to estimate the severity of Neural Foraminal Narrowing and Subarticular Stenosis from sagittal T1, sagittal T2/STIR, and axial T2 images. The model structure and the number of input slices are identical to those of the Center Classifier.\n\nAfter verifying various patterns of input-output combinations for the model, we found that the most effective approach was to input groups of sagittal T1, sagittal T2, and axial T2 slices at arbitrary disc levels and arbitrary sides (left or right) to estimate the severity of Neural Foraminal Narrowing and Subarticular Stenosis. By applying the Split LR preprocessing and flipping the right-side images to increase data, prediction accuracy improved. During training, we treated each group of slices as an independent data point without distinguishing disc levels or sides of the body. In other words, the model is designed to learn the characteristics of these conditions from the input slice groups, regardless of disc level or side, and estimate the severity based on those features. This allowed us to secure ten times the amount of data per condition, which we believe contributed to the improvement in accuracy.\n\n## Team Validation Strategy\n\n- **StratifiedKFold**\n - `y`: Number of moderate or higher severity cases included in one study\n - `groups`: `study_id`\n- Reference code: [Lumbar RSNA 2024 EDA + 3D Visualizationn](https://www.kaggle.com/code/artemtprv/lumbar-rsna-2024-eda-3d-visualization)\n\n## Pseudo Labeling\n\nFor items without ground truth labels, we used the predictions of the trained model as soft labels. The change in accuracy due to the presence or absence of pseudo-labels was not significant, but we introduced the use of pseudo-labels as an option to ensure model diversity.\n\n## Ensemble\n\nThe highest CV score for a single model was **0.3858**, achieved by combining the Center Classifier (Type B) ConvNeXt-T and the Side Classifier (Type B) ConvNeXt-N.\n\nThe ensemble CV score was **0.3643**, obtained by simply averaging 30 models (15 Center models and 15 Side models) with diversity in input image types, model architectures, data augmentations, auxiliary losses, pseudo-labels, etc.\n\n## Post-processing\n\nWe applied Temperature Scaling with a temperature of **0.91** to the logits of Spinal Canal Stenosis, sharpening the predicted probabilities.\n\n\n\n## What Didn't Work\n\n- One-stage solution\n- Multi-level Multi-disease models\n- Multi-level Single-disease models\n- Models specialized for each disc level\n- Models specialized for each side of the body\n- 3D-CNN\n- 2.5D-CNN + Attention\n- 2D-CNN + LSTM\n- Focal Loss\n- Long epochs\n\n## Code (Updated on 2024-10-27)\n\nhttps://github.com/Moyasii/Kaggle-2024-RSNA-Pub\n\n## Video (Updated on 2024-10-28)\n\nhttps://www.youtube.com/watch?v=e2uRj5f9Lms&ab_channel=sugupoko", "3012397": "# Not in the Final Submission\n- We decided not to use the following external dataset [Spinal Disease Dataset](https://tianchi.aliyun.com/dataset/79463) one week before the deadline. The reason was that we were unsure if the content of the \"Terms of Use\" complied with Kaggle's rules. Using this dataset showed an approximate performance improvement of +0.005 in a single model. \n- The DICOM information were corrupted, making it difficult to determine which image it corresponded to.", "3012532": "Great explanations! Do you think that temperature scaling had a bigger impact because of the noise in the dataset or just because 🤔", "3012618": "Thank you for sharing your detailed solution. Congratulations, great work!", "3013054": "Congratulations on winning the 3rd prize in this competition. Thanks for sharing the details of your solution with diagrams and images.", "3013384": "Thanks for sharing and explaining your solution in depth, awesome work!", "3014608": "Thanks for sharing and explaining your solution in depth, awesome work!", "3014935": "Great explanations!", "3020103": "Shocking! Thank you for this very detailed solution, which has made me realize the huge gap between me and the masters. I'm also looking forward to your code!!! I believe I can learn a lot from here.", "3021195": "Did you use DICOM format images, or did you switch to another format (like PNG)?\"", "3024953": "Any updates on the code?" }, "source": "meta" }