{
  "id": 110394,
  "title": "11th place solution - AttentionHeads",
  "url": "/competitions/recursion-cellular-image-classification/discussion/110394",
  "author_name": "Vlad Shmyhlo ",
  "post_date": "2019-09-27T10:04:04.094000",
  "votes": 22,
  "comment_count": 3,
  "views": 0,
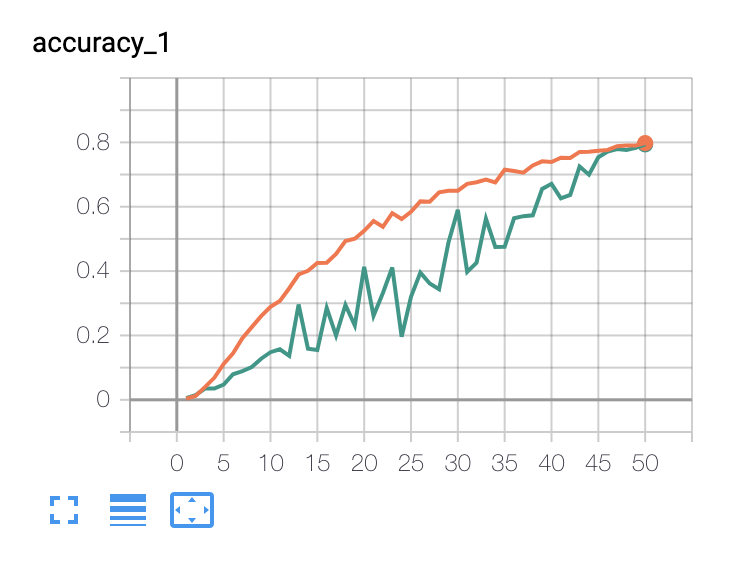
  "content": "<h1>AttentionHeads</h1>\n\n<p>First of all, many thanks to my teammates, <a href=\"/dempton\">@dempton</a>, <a href=\"/ddanevskyi\">@ddanevskyi</a>, <a href=\"/orgunova\">@orgunova</a> and <a href=\"/cutlass90\">@cutlass90</a>. Also our congratulations to <a href=\"/dempton\">@dempton</a> for getting his Grandmaster badge.\nSo, here is our (pretty simple) approach.</p>\n\n<h1>Model</h1>\n\n<ul>\n<li>Ensemble of 2 <strong>EfficientNets</strong>: B0, B5</li>\n<li><strong>6 channel</strong> input with first Conv layer replaced with 6 channel version</li>\n<li><strong>Batch Normalization</strong> before first Conv layer</li>\n<li>We normalize each image using mean/std <strong>computed on all images in experiment</strong></li>\n</ul>\n\n<h1>Training</h1>\n\n<ul>\n<li>Simplest approach possible: <strong>3-fold split, stratified by cell type</strong>, as well as by <strong>visual appearance</strong>: We made simple visualizations of experiments within cell type and tried to split similarly looking experiments into different folds, so to have all kinds of images in every fold.</li>\n<li>No smart sampling or special losses, just basic <strong>Cross Entropy</strong>, without label smoothing or metric learning</li>\n<li><strong>SGD</strong> with <a href=\"https://arxiv.org/abs/1907.08610\">LookAhead optimizer</a> (a=0.5, k=5) and 4-step <strong>gradient accumulation</strong></li>\n<li><a href=\"https://sgugger.github.io/the-1cycle-policy.html\">1cycle policy and LR range test</a> to find best learning rate for training</li>\n<li><strong>Polyak averaging</strong> (exponentially weighted version). When evaluating model we used exponentially weighted average of model parameters instead instead of last/best parameters, this does not give any performance improvements of final model, but has very pleasant <strong>smoothing effect on metric/loss curves</strong> and gives huge performance improvements in almost all training steps except for the very last, where it reaches same performance as model without averaging\n<img src=\"https://www.googleapis.com/download/storage/v1/b/kaggle-user-content/o/inbox%2F726978%2F6d0d5effe9c9f35f100cde2c0ec5bf2e%2FScreen%20Shot%202019-09-27%20at%2012.44.21%20PM.png?generation=1569577526910469&amp;alt=media\" alt=\"polyak averaging effect\"></li>\n<li>Augmentations: randomly sample site and apply flip and transpose, as well as random <strong>channel reweighting</strong> (just multiply each channel by some positive values with restriction that they should sum to 6)</li>\n<li><strong>Progressive resize</strong> during training: starting from random crops of size 224 we linearly scale crop size to 512. This gives <strong>2x faster training</strong> without drop in performance</li>\n<li>1 round of <strong>pseudo labeling</strong>. We just selected top-K samples with most confident predictions, added them to each fold's train set and finetuned our models for several additional epochs</li>\n</ul>\n\n<h1>Post-processing</h1>\n\n<ul>\n<li><strong>LAP solver</strong> within each experiment to assign classes to images</li>\n<li><strong>Softmax Temperature</strong>. Just multiply logits by some positive number before taking softmax <code>(logits * t).softmax()</code>, this sharpens or softens distribution which has huge impact on perfrmonace when used with LAP. Temperature value can be picked on validation set.</li>\n<li>The \"277 classes per plate\" trick. It might be different from what other participant were doing, but basically we did the following:\n<ol><li>Search for best <strong>temperature</strong> that maximizes metric.</li>\n<li>Use <strong>LAP</strong> within experiment to get model predictions.</li>\n<li>Now we need to decide: within each experiment, what sirna groups should be assigned to each plate. The next step if to just <strong>zero out probabilities</strong> of classes which <strong>does not belong to this group</strong>.</li>\n<li>Run <strong>LAP</strong> again.</li></ol></li>\n</ul>\n\n<h1>TTA</h1>\n\n<ul>\n<li><strong>None</strong>, just average of 2 sites</li>\n</ul>\n\n<h1>Tools and hardware</h1>\n\n<ul>\n<li><strong>PyTorch</strong></li>\n<li>1-2 1080ti most of the time, and about 8 GPUs in last 2-3 days.</li>\n<li><a href=\"https://github.com/gatagat/lap\">LAP solver</a></li>\n</ul>",
  "messages": [
    {
      "id": 635252,
      "postDate": "2019-09-27T10:04:04.093Z",
      "content": "<h1>AttentionHeads</h1>\n\n<p>First of all, many thanks to my teammates, <a href=\"/dempton\">@dempton</a>, <a href=\"/ddanevskyi\">@ddanevskyi</a>, <a href=\"/orgunova\">@orgunova</a> and <a href=\"/cutlass90\">@cutlass90</a>. Also our congratulations to <a href=\"/dempton\">@dempton</a> for getting his Grandmaster badge.\nSo, here is our (pretty simple) approach.</p>\n\n<h1>Model</h1>\n\n<ul>\n<li>Ensemble of 2 <strong>EfficientNets</strong>: B0, B5</li>\n<li><strong>6 channel</strong> input with first Conv layer replaced with 6 channel version</li>\n<li><strong>Batch Normalization</strong> before first Conv layer</li>\n<li>We normalize each image using mean/std <strong>computed on all images in experiment</strong></li>\n</ul>\n\n<h1>Training</h1>\n\n<ul>\n<li>Simplest approach possible: <strong>3-fold split, stratified by cell type</strong>, as well as by <strong>visual appearance</strong>: We made simple visualizations of experiments within cell type and tried to split similarly looking experiments into different folds, so to have all kinds of images in every fold.</li>\n<li>No smart sampling or special losses, just basic <strong>Cross Entropy</strong>, without label smoothing or metric learning</li>\n<li><strong>SGD</strong> with <a href=\"https://arxiv.org/abs/1907.08610\">LookAhead optimizer</a> (a=0.5, k=5) and 4-step <strong>gradient accumulation</strong></li>\n<li><a href=\"https://sgugger.github.io/the-1cycle-policy.html\">1cycle policy and LR range test</a> to find best learning rate for training</li>\n<li><strong>Polyak averaging</strong> (exponentially weighted version). When evaluating model we used exponentially weighted average of model parameters instead instead of last/best parameters, this does not give any performance improvements of final model, but has very pleasant <strong>smoothing effect on metric/loss curves</strong> and gives huge performance improvements in almost all training steps except for the very last, where it reaches same performance as model without averaging\n<img src=\"https://www.googleapis.com/download/storage/v1/b/kaggle-user-content/o/inbox%2F726978%2F6d0d5effe9c9f35f100cde2c0ec5bf2e%2FScreen%20Shot%202019-09-27%20at%2012.44.21%20PM.png?generation=1569577526910469&amp;alt=media\" alt=\"polyak averaging effect\"></li>\n<li>Augmentations: randomly sample site and apply flip and transpose, as well as random <strong>channel reweighting</strong> (just multiply each channel by some positive values with restriction that they should sum to 6)</li>\n<li><strong>Progressive resize</strong> during training: starting from random crops of size 224 we linearly scale crop size to 512. This gives <strong>2x faster training</strong> without drop in performance</li>\n<li>1 round of <strong>pseudo labeling</strong>. We just selected top-K samples with most confident predictions, added them to each fold's train set and finetuned our models for several additional epochs</li>\n</ul>\n\n<h1>Post-processing</h1>\n\n<ul>\n<li><strong>LAP solver</strong> within each experiment to assign classes to images</li>\n<li><strong>Softmax Temperature</strong>. Just multiply logits by some positive number before taking softmax <code>(logits * t).softmax()</code>, this sharpens or softens distribution which has huge impact on perfrmonace when used with LAP. Temperature value can be picked on validation set.</li>\n<li>The \"277 classes per plate\" trick. It might be different from what other participant were doing, but basically we did the following:\n<ol><li>Search for best <strong>temperature</strong> that maximizes metric.</li>\n<li>Use <strong>LAP</strong> within experiment to get model predictions.</li>\n<li>Now we need to decide: within each experiment, what sirna groups should be assigned to each plate. The next step if to just <strong>zero out probabilities</strong> of classes which <strong>does not belong to this group</strong>.</li>\n<li>Run <strong>LAP</strong> again.</li></ol></li>\n</ul>\n\n<h1>TTA</h1>\n\n<ul>\n<li><strong>None</strong>, just average of 2 sites</li>\n</ul>\n\n<h1>Tools and hardware</h1>\n\n<ul>\n<li><strong>PyTorch</strong></li>\n<li>1-2 1080ti most of the time, and about 8 GPUs in last 2-3 days.</li>\n<li><a href=\"https://github.com/gatagat/lap\">LAP solver</a></li>\n</ul>",
      "rawMarkdown": "# AttentionHeads\nFirst of all, many thanks to my teammates, @dempton, @ddanevskyi, @orgunova and @cutlass90. Also our congratulations to @dempton for getting his Grandmaster badge.\nSo, here is our (pretty simple) approach.\n\n# Model\n* Ensemble of 2 **EfficientNets**: B0, B5\n* **6 channel** input with first Conv layer replaced with 6 channel version\n* **Batch Normalization** before first Conv layer\n* We normalize each image using mean/std **computed on all images in experiment**\n\n# Training\n* Simplest approach possible: **3-fold split, stratified by cell type**, as well as by **visual appearance**: We made simple visualizations of experiments within cell type and tried to split similarly looking experiments into different folds, so to have all kinds of images in every fold.\n* No smart sampling or special losses, just basic **Cross Entropy**, without label smoothing or metric learning\n* **SGD** with [LookAhead optimizer](https://arxiv.org/abs/1907.08610) (a=0.5, k=5) and 4-step **gradient accumulation**\n* [1cycle policy and LR range test](https://sgugger.github.io/the-1cycle-policy.html) to find best learning rate for training\n* **Polyak averaging** (exponentially weighted version). When evaluating model we used exponentially weighted average of model parameters instead instead of last/best parameters, this does not give any performance improvements of final model, but has very pleasant **smoothing effect on metric/loss curves** and gives huge performance improvements in almost all training steps except for the very last, where it reaches same performance as model without averaging\n![polyak averaging effect](https://www.googleapis.com/download/storage/v1/b/kaggle-user-content/o/inbox%2F726978%2F6d0d5effe9c9f35f100cde2c0ec5bf2e%2FScreen%20Shot%202019-09-27%20at%2012.44.21%20PM.png?generation=1569577526910469&amp;alt=media)\n* Augmentations: randomly sample site and apply flip and transpose, as well as random **channel reweighting** (just multiply each channel by some positive values with restriction that they should sum to 6)\n* **Progressive resize** during training: starting from random crops of size 224 we linearly scale crop size to 512. This gives **2x faster training** without drop in performance\n* 1 round of **pseudo labeling**. We just selected top-K samples with most confident predictions, added them to each fold's train set and finetuned our models for several additional epochs\n\n# Post-processing\n* **LAP solver** within each experiment to assign classes to images\n* **Softmax Temperature**. Just multiply logits by some positive number before taking softmax `(logits * t).softmax()`, this sharpens or softens distribution which has huge impact on perfrmonace when used with LAP. Temperature value can be picked on validation set.\n* The \"277 classes per plate\" trick. It might be different from what other participant were doing, but basically we did the following:\n1. Search for best **temperature** that maximizes metric.\n2. Use **LAP** within experiment to get model predictions.\n3. Now we need to decide: within each experiment, what sirna groups should be assigned to each plate. The next step if to just **zero out probabilities** of classes which **does not belong to this group**.\n4. Run **LAP** again.\n\n# TTA\n* **None**, just average of 2 sites\n\n# Tools and hardware\n* **PyTorch**\n* 1-2 1080ti most of the time, and about 8 GPUs in last 2-3 days.\n* [LAP solver](https://github.com/gatagat/lap)",
      "votes": 22
    },
    {
      "id": 635326,
      "postDate": "2019-09-27T11:36:11.343Z",
      "content": "<p><a href=\"/vshmyhlo\">@vshmyhlo</a> <code>We normalize each image using mean/std computed on all images in experiment</code>.\nCan you explain this and how much was the improvement from per channel normalization for each image.\nThanks</p>",
      "rawMarkdown": "@vshmyhlo `` We normalize each image using mean/std computed on all images in experiment ``.\nCan you explain this and how much was the improvement from per channel normalization for each image.\nThanks",
      "replies": [
        {
          "id": 635335,
          "postDate": "2019-09-27T11:55:12.873Z",
          "content": "<p>Usually when you normalize images for conv net you compute per channel mean and std for all images in your train set and use this stat during training/evaluation/inference. We did the same, but had statistics computed only on images from same experiment, i.e. normalize each image from HUVEC-05 using stats computed on all images in HUVEC-05. I couldn't remember all the numbers but it gave about 0.02 improvement.</p>",
          "rawMarkdown": "Usually when you normalize images for conv net you compute per channel mean and std for all images in your train set and use this stat during training/evaluation/inference. We did the same, but had statistics computed only on images from same experiment, i.e. normalize each image from HUVEC-05 using stats computed on all images in HUVEC-05. I couldn't remember all the numbers but it gave about 0.02 improvement.",
          "votes": 1
        }
      ]
    },
    {
      "id": 635265,
      "postDate": "2019-09-27T10:21:28.857Z",
      "rawMarkdown": "",
      "isDeleted": true
    }
  ],
  "comments": [
    {
      "id": 635326,
      "author_name": "Deepshad",
      "author_url": "",
      "post_date": "2019-09-27T11:36:11.343000",
      "content": "<p><a href=\"/vshmyhlo\">@vshmyhlo</a> <code>We normalize each image using mean/std computed on all images in experiment</code>.\nCan you explain this and how much was the improvement from per channel normalization for each image.\nThanks</p>",
      "votes": 0,
      "replies": [
        {
          "id": 635335,
          "author_name": "Vlad Shmyhlo ",
          "author_url": "",
          "post_date": "2019-09-27T11:55:12.873000",
          "content": "<p>Usually when you normalize images for conv net you compute per channel mean and std for all images in your train set and use this stat during training/evaluation/inference. We did the same, but had statistics computed only on images from same experiment, i.e. normalize each image from HUVEC-05 using stats computed on all images in HUVEC-05. I couldn't remember all the numbers but it gave about 0.02 improvement.</p>",
          "votes": 1,
          "replies": []
        }
      ]
    },
    {
      "id": 635265,
      "author_name": "",
      "author_url": "",
      "post_date": "2019-09-27T10:21:28.857000",
      "content": "",
      "votes": 0,
      "replies": []
    }
  ],
  "raw_markdown_by_id": {
    "635252": "# AttentionHeads\nFirst of all, many thanks to my teammates, @dempton, @ddanevskyi, @orgunova and @cutlass90. Also our congratulations to @dempton for getting his Grandmaster badge.\nSo, here is our (pretty simple) approach.\n\n# Model\n* Ensemble of 2 **EfficientNets**: B0, B5\n* **6 channel** input with first Conv layer replaced with 6 channel version\n* **Batch Normalization** before first Conv layer\n* We normalize each image using mean/std **computed on all images in experiment**\n\n# Training\n* Simplest approach possible: **3-fold split, stratified by cell type**, as well as by **visual appearance**: We made simple visualizations of experiments within cell type and tried to split similarly looking experiments into different folds, so to have all kinds of images in every fold.\n* No smart sampling or special losses, just basic **Cross Entropy**, without label smoothing or metric learning\n* **SGD** with [LookAhead optimizer](https://arxiv.org/abs/1907.08610) (a=0.5, k=5) and 4-step **gradient accumulation**\n* [1cycle policy and LR range test](https://sgugger.github.io/the-1cycle-policy.html) to find best learning rate for training\n* **Polyak averaging** (exponentially weighted version). When evaluating model we used exponentially weighted average of model parameters instead instead of last/best parameters, this does not give any performance improvements of final model, but has very pleasant **smoothing effect on metric/loss curves** and gives huge performance improvements in almost all training steps except for the very last, where it reaches same performance as model without averaging\n![polyak averaging effect](https://www.googleapis.com/download/storage/v1/b/kaggle-user-content/o/inbox%2F726978%2F6d0d5effe9c9f35f100cde2c0ec5bf2e%2FScreen%20Shot%202019-09-27%20at%2012.44.21%20PM.png?generation=1569577526910469&amp;alt=media)\n* Augmentations: randomly sample site and apply flip and transpose, as well as random **channel reweighting** (just multiply each channel by some positive values with restriction that they should sum to 6)\n* **Progressive resize** during training: starting from random crops of size 224 we linearly scale crop size to 512. This gives **2x faster training** without drop in performance\n* 1 round of **pseudo labeling**. We just selected top-K samples with most confident predictions, added them to each fold's train set and finetuned our models for several additional epochs\n\n# Post-processing\n* **LAP solver** within each experiment to assign classes to images\n* **Softmax Temperature**. Just multiply logits by some positive number before taking softmax `(logits * t).softmax()`, this sharpens or softens distribution which has huge impact on perfrmonace when used with LAP. Temperature value can be picked on validation set.\n* The \"277 classes per plate\" trick. It might be different from what other participant were doing, but basically we did the following:\n1. Search for best **temperature** that maximizes metric.\n2. Use **LAP** within experiment to get model predictions.\n3. Now we need to decide: within each experiment, what sirna groups should be assigned to each plate. The next step if to just **zero out probabilities** of classes which **does not belong to this group**.\n4. Run **LAP** again.\n\n# TTA\n* **None**, just average of 2 sites\n\n# Tools and hardware\n* **PyTorch**\n* 1-2 1080ti most of the time, and about 8 GPUs in last 2-3 days.\n* [LAP solver](https://github.com/gatagat/lap)",
    "635326": "@vshmyhlo `` We normalize each image using mean/std computed on all images in experiment ``.\nCan you explain this and how much was the improvement from per channel normalization for each image.\nThanks",
    "635265": ""
  }
}