
First of all, I would like to thank to Kaggle and INGV (Istituto nazionale di geofisica e vulcanologia) National Institute of Geophysics and Volcanology for organizing this competition. This was a great opportunity to learn. I really enjoyed the challenge.
\nI would also like to thank everyone that shared either data, insights or ideas about this competition mainly @ajcostarino, @amanooo and @carpediemamigo
\nWell, I present my approach to this competition I only managed to get position 14th (12th on public). However, I think people could learn from my experience.
\nI mainly focused my efforts on two things:
\n• Data and feature engineering
\n• Stacking models.
\nIn my work, I only used 2 models:
\n• XGboost
\n• K nearest neighbours
I experimented with other models like tensorflow keras neural networks and elastic nets. However, these models did not provide good results so I did not focus on them. I also included two models in my stack provided by public notebooks:
\nhttps://www.kaggle.com/amanooo/ingv-volcanic-basic-solution-stft
\nhttps://www.kaggle.com/carpediemamigo/ingv-catboost-baseline-tsfresh
a) Data Processing and Feature Engineering:
\nHere is the data feature engineering I performed:
\n• I extracted classic statistics, lta-sta features, and sftf features directly from the provided files
\n• I extracted the same features from some data transformation of the sensors signals like for example a windowed RMS extraction, cumulative sum, and derivative signals.
\n• To overcome the missing values I used a simple fill with zero.
\n• I used a PCA on the sensors data to create new signal to be used. Thus, I trained my PCA on 2000 files (Too big data set to be loaded in total) and because the train set and the test set were not identically from the same distribution. I used some files from the test set. I know physically this does not make sense but it showed some good results.
\n• I also summed all sensors data in the files into one single signal and extracted the same features.
\n• I used directly the data of the TSFresh and the STFT from the public notebooks.
\n• For some of these datasets I performed some EDA and some feature selection technique (mainly based on the feature importance and of visualization). Please note that I didn’t simply drop the useless features instead I used a PCA on them and kept 5 components Some of which improved the results.
\n• Finally, this trick improved quite the results like by 400 000 in the MAE. I clustered the observation per sensor. The obtained clusters depended on the used dataset and some were completely useless while others allowed to detect some small clusters that improved my CV and my LB by about 200 000. The other 200 000 come from using mean encoding (by extracting max, min, mean, IQR) of the clusters. To do this I performed a Cross-Validation to ensure no data leakage and regularization of the features.
b) Modeling:
\nThe obtained dataset were used in the following pipeline of the final submission. I also tried other configuration but this one is the submitted one.
\n
As I mentioned the black hashed arrows corresponds to dataset that I used to cluster observations and include the mean encodings.
\nc) Robustness:
\nFor this competition, each of the XGboost model was trained on a 10 fold CV (in some cases 5 Stratified folds if the clusters were included) and their outcomes are averaged on 7 seeds. For the KNN models I used a leave one out schema.
\nI hope my explanation is clear. Please let me know what do you think of this.
", "messages": [ { "id": "1142420", "postDate": "01/07/2021 11:12:54", "content": "First of all, I would like to thank to Kaggle and INGV (Istituto nazionale di geofisica e vulcanologia) National Institute of Geophysics and Volcanology for organizing this competition. This was a great opportunity to learn. I really enjoyed the challenge.
\nI would also like to thank everyone that shared either data, insights or ideas about this competition mainly @ajcostarino, @amanooo and @carpediemamigo
\nWell, I present my approach to this competition I only managed to get position 14th (12th on public). However, I think people could learn from my experience.
\nI mainly focused my efforts on two things:
\n• Data and feature engineering
\n• Stacking models.
\nIn my work, I only used 2 models:
\n• XGboost
\n• K nearest neighbours
I experimented with other models like tensorflow keras neural networks and elastic nets. However, these models did not provide good results so I did not focus on them. I also included two models in my stack provided by public notebooks:
\nhttps://www.kaggle.com/amanooo/ingv-volcanic-basic-solution-stft
\nhttps://www.kaggle.com/carpediemamigo/ingv-catboost-baseline-tsfresh
a) Data Processing and Feature Engineering:
\nHere is the data feature engineering I performed:
\n• I extracted classic statistics, lta-sta features, and sftf features directly from the provided files
\n• I extracted the same features from some data transformation of the sensors signals like for example a windowed RMS extraction, cumulative sum, and derivative signals.
\n• To overcome the missing values I used a simple fill with zero.
\n• I used a PCA on the sensors data to create new signal to be used. Thus, I trained my PCA on 2000 files (Too big data set to be loaded in total) and because the train set and the test set were not identically from the same distribution. I used some files from the test set. I know physically this does not make sense but it showed some good results.
\n• I also summed all sensors data in the files into one single signal and extracted the same features.
\n• I used directly the data of the TSFresh and the STFT from the public notebooks.
\n• For some of these datasets I performed some EDA and some feature selection technique (mainly based on the feature importance and of visualization). Please note that I didn’t simply drop the useless features instead I used a PCA on them and kept 5 components Some of which improved the results.
\n• Finally, this trick improved quite the results like by 400 000 in the MAE. I clustered the observation per sensor. The obtained clusters depended on the used dataset and some were completely useless while others allowed to detect some small clusters that improved my CV and my LB by about 200 000. The other 200 000 come from using mean encoding (by extracting max, min, mean, IQR) of the clusters. To do this I performed a Cross-Validation to ensure no data leakage and regularization of the features.
b) Modeling:
\nThe obtained dataset were used in the following pipeline of the final submission. I also tried other configuration but this one is the submitted one.
\n
As I mentioned the black hashed arrows corresponds to dataset that I used to cluster observations and include the mean encodings.
\nc) Robustness:
\nFor this competition, each of the XGboost model was trained on a 10 fold CV (in some cases 5 Stratified folds if the clusters were included) and their outcomes are averaged on 7 seeds. For the KNN models I used a leave one out schema.
\nI hope my explanation is clear. Please let me know what do you think of this.
", "rawMarkdown": "First of all, I would like to thank to Kaggle and INGV (Istituto nazionale di geofisica e vulcanologia) National Institute of Geophysics and Volcanology for organizing this competition. This was a great opportunity to learn. I really enjoyed the challenge. \n\nI would also like to thank everyone that shared either data, insights or ideas about this competition mainly @ajcostarino, @amanooo and @carpediemamigo \n\nWell, I present my approach to this competition I only managed to get position 14th (12th on public). However, I think people could learn from my experience. \n\nI mainly focused my efforts on two things: \n•\tData and feature engineering \n•\tStacking models. \nIn my work, I only used 2 models: \n•\tXGboost\n•\tK nearest neighbours\n\nI experimented with other models like tensorflow keras neural networks and elastic nets. However, these models did not provide good results so I did not focus on them. I also included two models in my stack provided by public notebooks: \nhttps://www.kaggle.com/amanooo/ingv-volcanic-basic-solution-stft\nhttps://www.kaggle.com/carpediemamigo/ingv-catboost-baseline-tsfresh \n\n**a) Data Processing and Feature Engineering:**\n\nHere is the data feature engineering I performed: \n•\tI extracted classic statistics, lta-sta features, and sftf features directly from the provided files \n•\tI extracted the same features from some data transformation of the sensors signals like for example a windowed RMS extraction, cumulative sum, and derivative signals. \n•\tTo overcome the missing values I used a simple fill with zero. \n•\tI used a PCA on the sensors data to create new signal to be used. Thus, I trained my PCA on 2000 files (Too big data set to be loaded in total) and because the train set and the test set were not identically from the same distribution. I used some files from the test set. I know physically this does not make sense but it showed some good results. \n•\tI also summed all sensors data in the files into one single signal and extracted the same features. \n•\tI used directly the data of the TSFresh and the STFT from the public notebooks. \n•\tFor some of these datasets I performed some EDA and some feature selection technique (mainly based on the feature importance and of visualization). Please note that I didn’t simply drop the useless features instead I used a PCA on them and kept 5 components Some of which improved the results. \n•\tFinally, this trick improved quite the results like by 400 000 in the MAE. I clustered the observation per sensor. The obtained clusters depended on the used dataset and some were completely useless while others allowed to detect some small clusters that improved my CV and my LB by about 200 000. The other 200 000 come from using mean encoding (by extracting max, min, mean, IQR) of the clusters. To do this I performed a Cross-Validation to ensure no data leakage and regularization of the features.\n\n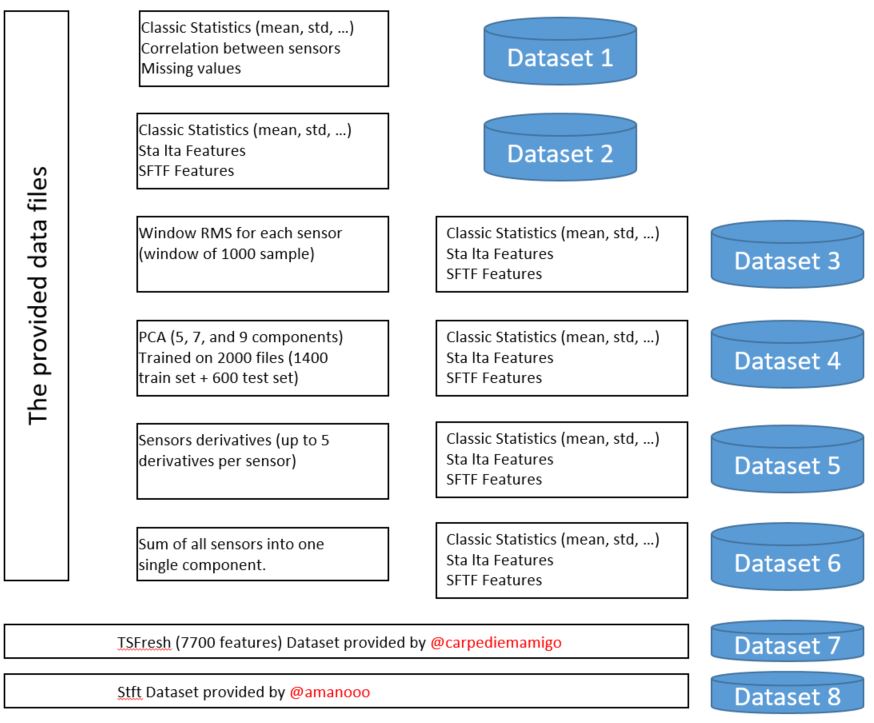\n\n \n**b) Modeling:** \n\nThe obtained dataset were used in the following pipeline of the final submission. I also tried other configuration but this one is the submitted one. \n\n\n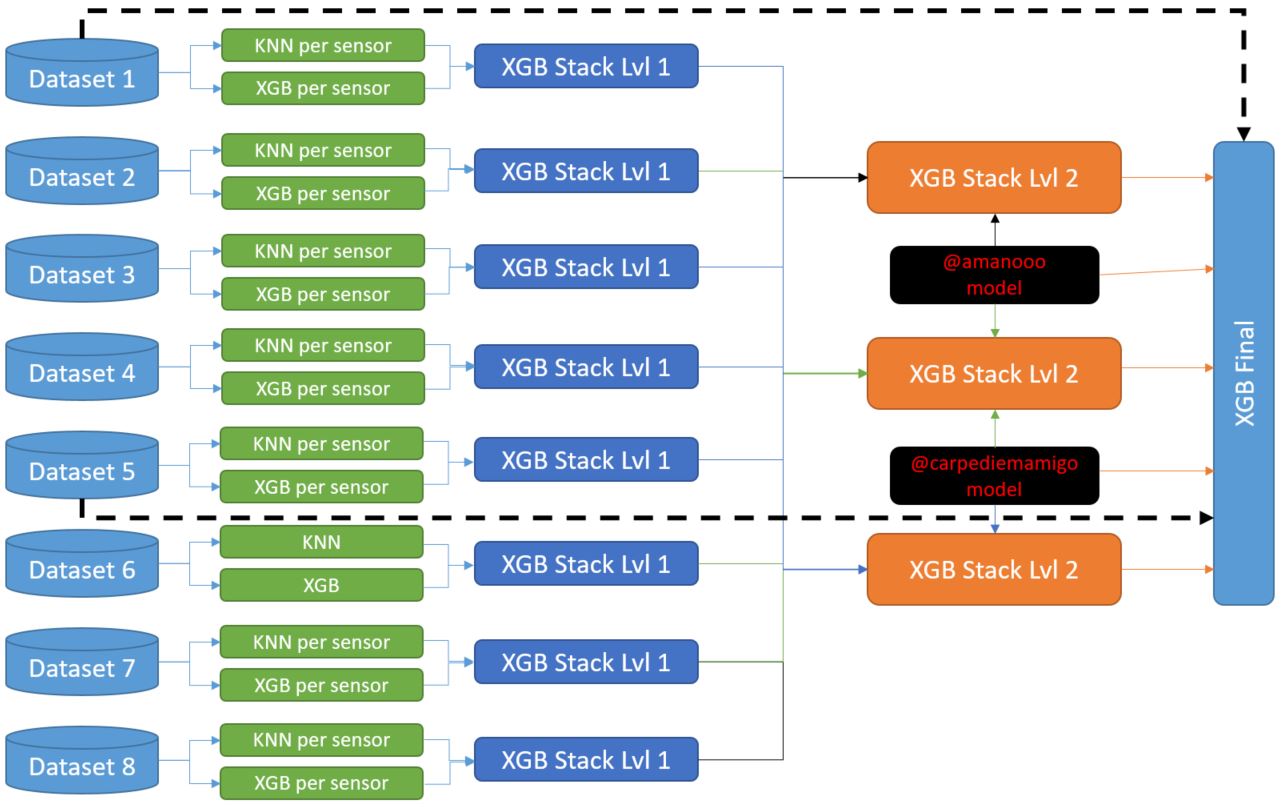\n\nAs I mentioned the black hashed arrows corresponds to dataset that I used to cluster observations and include the mean encodings.\n\n\n**c) Robustness:**\n\nFor this competition, each of the XGboost model was trained on a 10 fold CV (in some cases 5 Stratified folds if the clusters were included) and their outcomes are averaged on 7 seeds. For the KNN models I used a leave one out schema. \n\nI hope my explanation is clear. Please let me know what do you think of this.", "votes": null }, { "id": "1142456", "postDate": "01/07/2021 11:53:07", "content": "Congratulations and thanks for sharing !
\nI'm curious to know if someone had better results than you, without using neural networks. Thank you.
Congrats, great solution! Thanks for sharing your approach, it's pretty useful. I would like to have some questions:
\nHello Levente. Thanks for your interest. So here is what I have done:
\nI hope this clarifies things. Let me know if you still have more questions.
", "rawMarkdown": "Hello Levente. Thanks for your interest. So here is what I have done: \n1. For the KNN. I actually considered two values the 5 and the 10. I made a small gridsearch to get the best values on the test sets and I ended up with 17 as the best one. However, when submitting this values I found the results are a bit dispointing. So I ended up using the 5 and the 10 neighbors. Please note that when using the KNN on the whole sensors the results are very dispointing and we have a big overfitting for the training set. However, when using it for a single sensor this improved the results drastically I'm talking about 11m vs 7.5m for the same dataset. \n2. I didn't implemented in a single process. I divided it into small chunks. each model was presented in a kaggle notebook then I merged the notebooks results for the next level. So basically for stacking I use the mean results of the previous model on the 7 seeds I didn't stack one seed at the time. \n\nI hope this clarifies things. Let me know if you still have more questions.", "votes": null }, { "id": "1142564", "postDate": "01/07/2021 13:22:37", "content": "Great insight in 1. for KNN. Thank you for your answers!
", "rawMarkdown": "Great insight in 1. for KNN. Thank you for your answers!", "votes": null }, { "id": "1142602", "postDate": "01/07/2021 13:47:33", "content": "Very nice work
", "rawMarkdown": "Very nice work", "votes": null } ], "comments": [ { "id": 1142456, "author_name": "adaubas", "author_url": "", "post_date": "01/07/2021 11:53:07", "content": "Congratulations and thanks for sharing !
\nI'm curious to know if someone had better results than you, without using neural networks. Thank you.
Congrats, great solution! Thanks for sharing your approach, it's pretty useful. I would like to have some questions:
\nHello Levente. Thanks for your interest. So here is what I have done:
\nI hope this clarifies things. Let me know if you still have more questions.
", "votes": null, "replies": [] }, { "id": 1142564, "author_name": "leventelippenszky", "author_url": "", "post_date": "01/07/2021 13:22:37", "content": "Great insight in 1. for KNN. Thank you for your answers!
", "votes": null, "replies": [] } ] }, { "id": 1142602, "author_name": "ajcostarino", "author_url": "", "post_date": "01/07/2021 13:47:33", "content": "Very nice work
", "votes": null, "replies": [] } ], "raw_markdown_by_id": { "1142420": "First of all, I would like to thank to Kaggle and INGV (Istituto nazionale di geofisica e vulcanologia) National Institute of Geophysics and Volcanology for organizing this competition. This was a great opportunity to learn. I really enjoyed the challenge. \n\nI would also like to thank everyone that shared either data, insights or ideas about this competition mainly @ajcostarino, @amanooo and @carpediemamigo \n\nWell, I present my approach to this competition I only managed to get position 14th (12th on public). However, I think people could learn from my experience. \n\nI mainly focused my efforts on two things: \n•\tData and feature engineering \n•\tStacking models. \nIn my work, I only used 2 models: \n•\tXGboost\n•\tK nearest neighbours\n\nI experimented with other models like tensorflow keras neural networks and elastic nets. However, these models did not provide good results so I did not focus on them. I also included two models in my stack provided by public notebooks: \nhttps://www.kaggle.com/amanooo/ingv-volcanic-basic-solution-stft\nhttps://www.kaggle.com/carpediemamigo/ingv-catboost-baseline-tsfresh \n\n**a) Data Processing and Feature Engineering:**\n\nHere is the data feature engineering I performed: \n•\tI extracted classic statistics, lta-sta features, and sftf features directly from the provided files \n•\tI extracted the same features from some data transformation of the sensors signals like for example a windowed RMS extraction, cumulative sum, and derivative signals. \n•\tTo overcome the missing values I used a simple fill with zero. \n•\tI used a PCA on the sensors data to create new signal to be used. Thus, I trained my PCA on 2000 files (Too big data set to be loaded in total) and because the train set and the test set were not identically from the same distribution. I used some files from the test set. I know physically this does not make sense but it showed some good results. \n•\tI also summed all sensors data in the files into one single signal and extracted the same features. \n•\tI used directly the data of the TSFresh and the STFT from the public notebooks. \n•\tFor some of these datasets I performed some EDA and some feature selection technique (mainly based on the feature importance and of visualization). Please note that I didn’t simply drop the useless features instead I used a PCA on them and kept 5 components Some of which improved the results. \n•\tFinally, this trick improved quite the results like by 400 000 in the MAE. I clustered the observation per sensor. The obtained clusters depended on the used dataset and some were completely useless while others allowed to detect some small clusters that improved my CV and my LB by about 200 000. The other 200 000 come from using mean encoding (by extracting max, min, mean, IQR) of the clusters. To do this I performed a Cross-Validation to ensure no data leakage and regularization of the features.\n\n\n\n \n**b) Modeling:** \n\nThe obtained dataset were used in the following pipeline of the final submission. I also tried other configuration but this one is the submitted one. \n\n\n\n\nAs I mentioned the black hashed arrows corresponds to dataset that I used to cluster observations and include the mean encodings.\n\n\n**c) Robustness:**\n\nFor this competition, each of the XGboost model was trained on a 10 fold CV (in some cases 5 Stratified folds if the clusters were included) and their outcomes are averaged on 7 seeds. For the KNN models I used a leave one out schema. \n\nI hope my explanation is clear. Please let me know what do you think of this.", "1142456": "Congratulations and thanks for sharing ! \nI'm curious to know if someone had better results than you, without using neural networks. Thank you.", "1142512": "Congrats, great solution! Thanks for sharing your approach, it's pretty useful. I would like to have some questions:\n1. You chose the number of neighbors in the KNNs using LOOCV? What was this number generally for you? I found that using a small number, i.e. 5-10 seriously overfits the training set, so I ended up using ~20. This didn't have that large gap between CV and LB but also had a worse LB score.\n2. How did you implement the pipeline for this huge ensemble model? I only used Kaggle Notebooks but I would be interested how to set up an efficient pipeline according to other Kagglers, e.g. in GitHub.", "1142543": "Hello Levente. Thanks for your interest. So here is what I have done: \n1. For the KNN. I actually considered two values the 5 and the 10. I made a small gridsearch to get the best values on the test sets and I ended up with 17 as the best one. However, when submitting this values I found the results are a bit dispointing. So I ended up using the 5 and the 10 neighbors. Please note that when using the KNN on the whole sensors the results are very dispointing and we have a big overfitting for the training set. However, when using it for a single sensor this improved the results drastically I'm talking about 11m vs 7.5m for the same dataset. \n2. I didn't implemented in a single process. I divided it into small chunks. each model was presented in a kaggle notebook then I merged the notebooks results for the next level. So basically for stacking I use the mean results of the previous model on the 7 seeds I didn't stack one seed at the time. \n\nI hope this clarifies things. Let me know if you still have more questions.", "1142564": "Great insight in 1. for KNN. Thank you for your answers!", "1142602": "Very nice work" }, "source": "meta" }