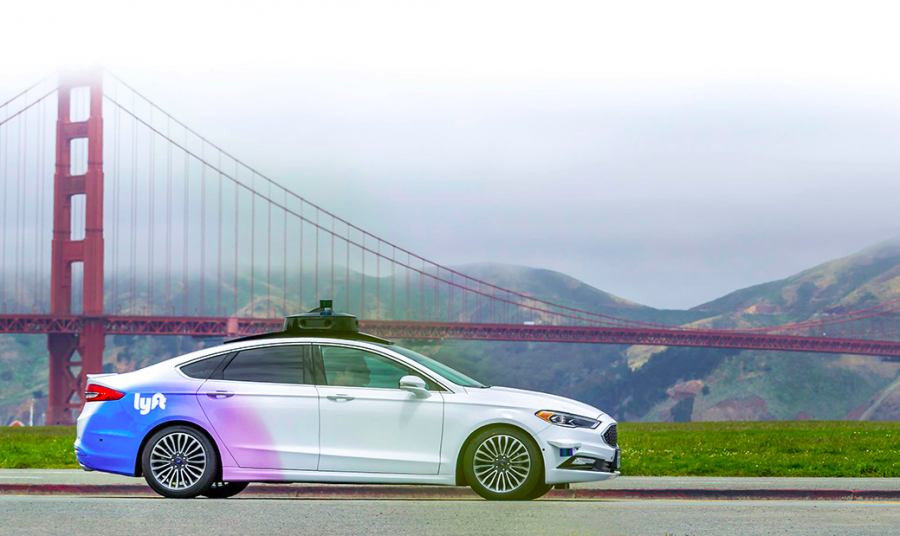
{"metadata":{"kernelspec":{"language":"python","display_name":"Python 3","name":"python3"},"language_info":{"name":"python","version":"3.7.6","mimetype":"text/x-python","codemirror_mode":{"name":"ipython","version":3},"pygments_lexer":"ipython3","nbconvert_exporter":"python","file_extension":".py"},"kaggle":{"accelerator":"gpu","dataSources":[{"sourceId":19990,"databundleVersionId":1472735,"sourceType":"competition"},{"sourceId":1440800,"sourceType":"datasetVersion","datasetId":844318},{"sourceId":1506707,"sourceType":"datasetVersion","datasetId":848151},{"sourceId":43196004,"sourceType":"kernelVersion"},{"sourceId":43673737,"sourceType":"kernelVersion"},{"sourceId":43970252,"sourceType":"kernelVersion"}],"dockerImageVersionId":29995,"isInternetEnabled":false,"language":"python","sourceType":"notebook","isGpuEnabled":true}},"nbformat_minor":4,"nbformat":4,"cells":[{"cell_type":"markdown","source":"<img src='https://neurohive.io/wp-content/uploads/2019/07/Screenshot-from-2019-07-25-01-30-57.png'>\n<p>\n<p>\n<h1><center>Lyft Motion Prediction for Autonomous Vehicles</center><h1>\n<h3><center>&#128663;Build motion prediction models for self-driving vehicles&#128663;</center><h3>","metadata":{}},{"cell_type":"markdown","source":"# Table of contents🗃<a id='0.1'></a>\n\n- [0. Introduction](#0)\n\n- [1. Import Packages](#1)\n\n- [2. Utility Functions](#2)\n- [3. Basic EDA](#3)\n    - [3.1 Data Formats](#3-1)\n        - [3.1.1 Introduction](#3-1-1)\n        - [3.1.2 Zarr Format](#3-1-2)\n        - [3.1.3 Train, Validation And Test Zarr](#3-1-3)\n    - [3.2 Checking Configuration Fields](#3-2)\n    - [3.3 Loading Data](#3-3)\n    - [3.4 Data Overview](#3-4)\n        - [3.4.1 Agents](#3-4-1)\n        - [3.4.2 Scenes](#3-4-2)\n        - [3.4.3 Frames](#3-4-3)\n    - [3.5 Dataset Package](#3-5)\n        - [3.5.1 ChunckedDataset](#3-5-1)\n    - [3.6 Visualize Autonomous Vehicle](#3-6)  \n        - [3.6.1 Visualizing Various Rasterizer Objects](#3-6-1)  \n        - [3.6.2 Visualize Trajectory: Semantic View](#3-6-2)\n        - [3.6.3 Visualize Trajectory: Satellite View](#3-6-3)\n        - [3.6.4 Visualize Agent](#3-6-4)\n        - [3.6.5 Visualize Individual Scene: Semantic](#3-6-5)\n        - [3.6.6 Visualize Individual Scene: Satellite](#3-6-6)\n        \n- [4. Pytorch Baseline](#4)\n    - [4.1 Configuration](#4-1)\n    - [4.2 Loading Training Data](#4-2)\n    - [4.3 Training DataLoader](#4-3)\n    - [4.4 Model: resnet50 (Pytorch)](#4-4)\n    - [4.5 Compilation](#4-5)\n    - [4.6 Training](#4-6)\n    - [4.7 Saving Model](#4-7)\n    \n- [5. Prediction and Results](#5)\n    - [5.1 Test DataLoader](#5-1)\n    - [5.2 Getting Predictions](#5-2)\n    - [5.2 Submission](#5-3)\n    \n- [6. Reference](#6)","metadata":{}},{"cell_type":"markdown","source":"# 0. <a id='0'>Introduction📃</a>\n\n[Table of Contents](#0.1)\n\nThis competition is hosted by ridesharing company [Lyft](https://www.lyft.com/) which started [Level 5](https://self-driving.lyft.com/level5/), self-driving division to tackle the challenges in the field of self-driving cars. \n\nIn this competition our task is to build motion prediction models for self-driving vehicles. Model which can predict the movement of traffic agents around the Autonomous Vehicles such as cars, cyclists, and pedestrians etc. We are required to predict how these different agents move in Autonomous Vehicles's environment.\n\n## What is Autonomous Vehicle?\n\nAn autonomous vehicle, or a driverless vehicle, is one that is able to operate itself and perform necessary functions without any human intervention, through ability to sense its surroundings.\n\nAn autonomous vehicle utilises a fully automated driving system in order to allow the vehicle to respond to external conditions that a human driver would manage.\n\n## Competition Data\n\nThis [dataset](https://www.kaggle.com/c/lyft-motion-prediction-autonomous-vehicles/data) is the largest collection of the traffic agent motion data. This dataset includes the logs of movement of cars, cyclists, pedestrians, and other traffic agents encountered by Lyft's autonomous fleet. These logs come from processing raw lidar, camera, and radar data through our team’s perception systems and are ideal for training motion prediction models. The dataset includes:\n\n* 1000+ hours of traffic agent movement\n* 16k miles of data from 23 vehicle\n* 15k semantic map annotations\n\nHere is the reserach paper of [Prediction Dataset](https://paperswithcode.com/paper/one-thousand-and-one-hours-self-driving).\n\nThe dataset consists of 170,000 scenes capturing the environment around the autonomous vehicle. Each scene encodes the state of the vehicle’s surroundings at a given point in time. [source](https://self-driving.lyft.com/level5/prediction/)\n\n<div style=\"clear:both;display:table\">\n<img src=\"https://self-driving.lyft.com/wp-content/uploads/2020/06/motion_dataset_lrg_redux.gif\" style=\"width:45%;float:left\"/>\n<img src=\"https://self-driving.lyft.com/wp-content/uploads/2020/06/motion_dataset_2-1.png\" style=\"width:45%;float:left\"/>\n</div>\n<br/>\n\nThis baseline solution is trained on over 2 million samples from the agent locations contained within the dataset. The model predicts a single agent at a time. First, a raster generates a bird’s eye view (BEV) top-down raster, which encodes all agents and the map. The network infers the future coordinates of the agent-based upon this raster.\n\n<img src=\"https://self-driving.lyft.com/wp-content/uploads/2020/06/diagram-prediction-1.jpg\" style=\"width:70%\"/>\n<br/>\n    \n## What we are predicting?\n\nOur task in the competition is to predict the motion of external objects such as cars, cyclist, pedestrains etc in order to assist the self-driving car. We have to predict the location of objects agents in the next 50 frames.\n\n## Evaluation Metric: Negative log-likelihood\n\nWe calculate the negative log-likelihood of the ground truth data given the multi-modal predictions. You can get more information [here](https://www.kaggle.com/c/lyft-motion-prediction-autonomous-vehicles/overview/evaluation).\n\n\n![](https://camo.githubusercontent.com/b3634eea5be5501318957e21086781666018efa1/68747470733a2f2f6c617465782e636f6465636f67732e636f6d2f6769662e6c617465783f25354362675f77686974652532302535436c617267652532304c2532302533442532302d2532302535436c6f6725323070253238785f253742312532432532302535436c646f747325324325323054253744253243253230795f253742312532432532302535436c646f74732532432532305425374425374363253545253742312532432532302535436c646f74732532432532304b253744253243253230253543626172253742782537445f253742312532432532302535436c646f747325324325323054253744253545253742312532432532302535436c646f74732532432532304b253744253243253230253543626172253742792537445f253742312532432532302535436c646f747325324325323054253744253545253742312532432532302535436c646f74732532432532304b253744253239)\n![](https://camo.githubusercontent.com/8048a110a20827715a17eb76f8039302a576d503/68747470733a2f2f6c617465782e636f6465636f67732e636f6d2f6769662e6c617465783f25354362675f77686974652532302535436c617267652532302533442532302d2532302535436c6f6725323025354373756d5f6b253230652535452537422535436c6f67253238632535456b2532392532302b25323025354373756d5f742532302535436c6f672532302535436d61746863616c2537424e253744253238785f74253743253543626172253742782537445f742535456b2532432532302535437369676d61253344312532392532302535436d61746863616c2537424e253744253238795f74253743253543626172253742792537445f742535456b2532432532302535437369676d6125334431253239253744)\n![](https://camo.githubusercontent.com/9ba94f5c0c40666d66b93fba994cc5f7623ebd98/68747470733a2f2f6c617465782e636f6465636f67732e636f6d2f6769662e6c617465783f25354362675f77686974652532302535436c617267652532302533442532302d2532302535436c6f6725323025354373756d5f6b253230652535452537422535436c6f67253238632535456b2532392532302d25354366726163253742312537442537423225374425323025354373756d5f74253230253238253543626172253742782537445f742535456b2532302d253230785f74253239253545322532302b253230253238253543626172253742792537445f742535456b2532302d253230795f7425323925354532253744)","metadata":{}},{"cell_type":"markdown","source":"## Lyft's Autonomous Vehicle (AV)\n\n**Lyft's** AV Introducton video.  ","metadata":{}},{"cell_type":"markdown","source":"# 1. <a id='1'>Import Packages📚</a>\n\n[Table of Contents](#0.1)\n\nWe are required to use [L5Kit toolkit](https://github.com/lyft/l5kit) provided by the competition host to prepare/preprocess data, trian and evaluate the model. Please add this [utility script](https://www.kaggle.com/pestipeti/lyft-l5kit-unofficial-fix) provided by [Peter's](https://www.kaggle.com/pestipeti) first by clicking on the [+ Add data]() section inside your notebook before starting. The [L5Kit toolkit](https://github.com/lyft/l5kit) has some issue right now. You can check [this](https://www.kaggle.com/c/lyft-motion-prediction-autonomous-vehicles/discussion/177125) discussion here for more information.  \n\n## L5Kit is a library which lets you:\n\n* Load driving scenes from zarr files\n* Read semantic maps\n* Read aerial maps\n* Create birds-eye-view (BEV) images which represent a scene around an AV or another vehicle\n* Sample data\n* Train neural networks\n* Visualize results","metadata":{}},{"cell_type":"code","source":"from IPython.display import HTML\n\nHTML('<center><iframe  width=\"850\" height=\"450\" src=\"https://www.youtube.com/embed/K0H43N-Hx7w\" frameborder=\"0\" allow=\"accelerometer; autoplay; encrypted-media; gyroscope; picture-in-picture\" allowfullscreen></iframe></center>')","metadata":{"trusted":true,"_kg_hide-input":true,"execution":{"iopub.status.busy":"2025-05-31T01:18:10.764606Z","iopub.execute_input":"2025-05-31T01:18:10.764916Z","iopub.status.idle":"2025-05-31T01:18:10.77028Z","shell.execute_reply.started":"2025-05-31T01:18:10.764886Z","shell.execute_reply":"2025-05-31T01:18:10.769233Z"}},"outputs":[],"execution_count":null},{"cell_type":"code","source":"import torch\nimport l5kit\nimport torchvision\nprint(torch.__version__, l5kit.__version__, torchvision.__version__)\nimport sys\nprint(sys.version)\n","metadata":{"trusted":true,"execution":{"iopub.status.busy":"2025-05-31T01:18:14.40898Z","iopub.execute_input":"2025-05-31T01:18:14.409317Z","iopub.status.idle":"2025-05-31T01:18:14.41563Z","shell.execute_reply.started":"2025-05-31T01:18:14.409281Z","shell.execute_reply":"2025-05-31T01:18:14.414585Z"}},"outputs":[],"execution_count":null},{"cell_type":"code","source":"# import packages\nimport os, gc\nimport zarr\nimport numpy as np \nimport pandas as pd \nfrom tqdm import tqdm\nfrom typing import Dict\nfrom collections import Counter\nfrom prettytable import PrettyTable\n\n#level5 toolkit\nfrom l5kit.data import PERCEPTION_LABELS\nfrom l5kit.dataset import EgoDataset, AgentDataset\nfrom l5kit.data import ChunkedDataset, LocalDataManager\n\n# level5 toolkit \nfrom l5kit.configs import load_config_data\nfrom l5kit.geometry import transform_points\nfrom l5kit.rasterization import build_rasterizer\nfrom l5kit.visualization import draw_trajectory, draw_reference_trajectory, TARGET_POINTS_COLOR\nfrom l5kit.evaluation import write_pred_csv, compute_metrics_csv, read_gt_csv, create_chopped_dataset\n\n# visualization\nimport seaborn as sns\nimport matplotlib.pyplot as plt\nfrom matplotlib import animation\nfrom colorama import Fore, Back, Style\n\n# deep learning\nimport torch\nfrom torch import nn, optim\nfrom torch.utils.data import DataLoader\nfrom torchvision.models.resnet import resnet18, resnet50, resnet34\n\n# check files in directory\nprint((os.listdir('../input/lyft-motion-prediction-autonomous-vehicles/')))\n\nplt.rc('animation', html='jshtml')\n\n%matplotlib inline","metadata":{"_uuid":"8f2839f25d086af736a60e9eeb907d3b93b6e0e5","_cell_guid":"b1076dfc-b9ad-4769-8c92-a6c4dae69d19","trusted":true,"_kg_hide-input":true,"execution":{"iopub.status.busy":"2025-05-31T01:18:16.809597Z","iopub.execute_input":"2025-05-31T01:18:16.810079Z","iopub.status.idle":"2025-05-31T01:18:16.830087Z","shell.execute_reply.started":"2025-05-31T01:18:16.810034Z","shell.execute_reply":"2025-05-31T01:18:16.828643Z"}},"outputs":[],"execution_count":null},{"cell_type":"markdown","source":"# 2. <a id='2'>Utility Functions🔨</a>\n\nThanks to [Trigram](https://www.kaggle.com/nxrprime) for providing this function.","metadata":{}},{"cell_type":"code","source":"# animation for scene\ndef animate_solution(images):\n\n    def animate(i):\n        im.set_data(images[i])\n \n    fig, ax = plt.subplots()\n    im = ax.imshow(images[0])\n    \n    return animation.FuncAnimation(fig, animate, frames=len(images), interval=80)","metadata":{"trusted":true,"_kg_hide-input":true,"execution":{"iopub.status.busy":"2025-05-31T01:18:19.976391Z","iopub.execute_input":"2025-05-31T01:18:19.976675Z","iopub.status.idle":"2025-05-31T01:18:19.981584Z","shell.execute_reply.started":"2025-05-31T01:18:19.976652Z","shell.execute_reply":"2025-05-31T01:18:19.980634Z"}},"outputs":[],"execution_count":null},{"cell_type":"markdown","source":"# 3. <a id='3'>EDA🔍</a>\n\n[Table of Contents](#0.1)\n\nThe data is huge around 22 GB. We will use Lyft's [L5Kit](https://github.com/lyft/l5kit) to process our data (loading and visualization) and training. \n\n## 3.1 <a id='3-1'>Data Formats</a>\n\nWe need to be familiar with the data we are using. Let's dive in.. \n\n### 3.1.1 <a id='3-1-1'>Introduction</a>\n\nThe L5Kit toolkit uses data format that consists of a set of numpy structured arrays. **[Structured arrays](https://numpy.org/doc/stable/user/basics.rec.html)** are ndarrays whose datatype is a composition of simpler datatypes organized as a sequence of named fields. The structured array can store various types of features. Structured arrays are stored in memory in an interleaved format, this means that one \"row\" or \"sample\" is grouped together in memory. Let us take an example to understand this. ","metadata":{}},{"cell_type":"code","source":"import numpy as np\nmy_arr = np.zeros(3, dtype=[(\"color\", (np.uint8, 3)), (\"label\", np.bool)])\n\nprint(my_arr[0])","metadata":{"trusted":true,"execution":{"iopub.status.busy":"2025-05-31T01:18:37.001276Z","iopub.execute_input":"2025-05-31T01:18:37.001566Z","iopub.status.idle":"2025-05-31T01:18:37.006748Z","shell.execute_reply.started":"2025-05-31T01:18:37.001542Z","shell.execute_reply":"2025-05-31T01:18:37.005979Z"}},"outputs":[],"execution_count":null},{"cell_type":"markdown","source":"let's add some data in this structured array.","metadata":{}},{"cell_type":"code","source":"my_arr[0][\"color\"] = [0, 218, 130]\nmy_arr[0][\"label\"] = True\nmy_arr[1][\"color\"] = [245, 59, 255]\nmy_arr[1][\"label\"] = True\nmy_arr[1][\"color\"] = [7, 6, 97]\nmy_arr[1][\"label\"] = True\n\nprint(my_arr)","metadata":{"trusted":true,"execution":{"iopub.status.busy":"2025-05-31T01:18:38.231997Z","iopub.execute_input":"2025-05-31T01:18:38.232329Z","iopub.status.idle":"2025-05-31T01:18:38.238555Z","shell.execute_reply.started":"2025-05-31T01:18:38.232293Z","shell.execute_reply":"2025-05-31T01:18:38.237598Z"}},"outputs":[],"execution_count":null},{"cell_type":"markdown","source":"As we can see structured arrays allow us to mix different data types into a single array. We will develop more intuition ahead.","metadata":{}},{"cell_type":"markdown","source":"### 3.1.2 <a id='3-1-2'>Zarr Format</a>\n\n[Table of Contents](#0.1)\n\nThe L5Kit uses zarr format to store and read these structured numpy arrays. The data is available in .zarr file format which can be easily load using the [L5Kit](https://github.com/lyft/l5kit). Most of the traditional numpy operations can be handled using .zarr files. The zarr files are flat, compact, and highly performant for loading. Each of the .zarr file contains - \n\n   * scenes: driving episodes acquired from a given vehicle.\n   * frames: snapshots in time of the pose of the vehicle. A frame is a snapshot in time which consists of ego pose, time, and multiple agent states.\n   * agents: a generic entity captured by the vehicle's sensors. Note that only 4 of the 17 possible agent label_probabilities are present in this dataset. Each agent state describes the position, orientation, bounds, and type.\n   * agents_mask: a mask that (for train and validation) masks out objects that aren't useful for training. In test, the mask (provided in files as mask.npz) masks out any test object for which predictions are NOT required.\n   * traffic_light_faces: traffic light information.\n","metadata":{}},{"cell_type":"markdown","source":"### 3.1.3 <a id='3-1-3'>Train, Validation And Test Zarr</a>\n\n[Table of Contents](#0.1)","metadata":{}},{"cell_type":"code","source":"train = zarr.open(\"../input/lyft-motion-prediction-autonomous-vehicles/scenes/train.zarr\")\nvalidation = zarr.open(\"../input/lyft-motion-prediction-autonomous-vehicles/scenes/validate.zarr\")\ntest = zarr.open(\"../input/lyft-motion-prediction-autonomous-vehicles/scenes/test.zarr/\")\ntrain.info","metadata":{"trusted":true,"execution":{"iopub.status.busy":"2025-05-31T01:10:20.095162Z","iopub.execute_input":"2025-05-31T01:10:20.095508Z","iopub.status.idle":"2025-05-31T01:10:20.127061Z","shell.execute_reply.started":"2025-05-31T01:10:20.095475Z","shell.execute_reply":"2025-05-31T01:10:20.126409Z"}},"outputs":[],"execution_count":null},{"cell_type":"markdown","source":"We can see that our train.zarr file has set of 4 arrays. All this 4 fields are described above in the **Data Format** section above. Let us check these fields. We will check 1 observation from each.","metadata":{}},{"cell_type":"code","source":"print(f'We have {len(train.agents)} agents, {len(train.scenes)} scenes, {len(train.frames)} frames and {len(train.traffic_light_faces)} traffic light faces in train.zarr.')\nprint(f'We have {len(validation.agents)} agents, {len(validation.scenes)} scenes, {len(validation.frames)} frames and {len(validation.traffic_light_faces)} traffic light faces in validation.zarr.')\nprint(f'We have {len(test.agents)} agents, {len(test.scenes)} scenes, {len(test.frames)} frames and {len(test.traffic_light_faces)} traffic light faces in test.zarr.')\n","metadata":{"_kg_hide-input":true,"trusted":true,"execution":{"iopub.status.busy":"2025-05-31T01:20:07.819464Z","iopub.execute_input":"2025-05-31T01:20:07.819764Z","iopub.status.idle":"2025-05-31T01:20:07.853397Z","shell.execute_reply.started":"2025-05-31T01:20:07.81974Z","shell.execute_reply":"2025-05-31T01:20:07.852684Z"}},"outputs":[],"execution_count":null},{"cell_type":"markdown","source":"The data is expected to live in a folder that can be configured using the L5KIT_DATA_FOLDER env variable. We will now develop some intuition about the data.","metadata":{}},{"cell_type":"code","source":"# set env variable for data\nos.environ[\"L5KIT_DATA_FOLDER\"] = \"../input/lyft-motion-prediction-autonomous-vehicles\"\n\n# get configuration yaml\ncfg = load_config_data(\"../input/lyft-config-files/visualisation_config.yaml\")\nprint(cfg)","metadata":{"_uuid":"d629ff2d2480ee46fbb7e2d37f6b5fab8052498a","_cell_guid":"79c7e3d0-c299-4dcb-8224-4455121ee9b0","trusted":true,"_kg_hide-output":false,"execution":{"iopub.status.busy":"2025-05-31T01:20:09.947453Z","iopub.execute_input":"2025-05-31T01:20:09.947753Z","iopub.status.idle":"2025-05-31T01:20:09.95917Z","shell.execute_reply.started":"2025-05-31T01:20:09.947728Z","shell.execute_reply":"2025-05-31T01:20:09.958328Z"}},"outputs":[],"execution_count":null},{"cell_type":"markdown","source":"## 3.2 <a id='3-2'>Checking Configuration Fields🗄</a>\n\n[Table of Contents](#0.1)\n\nWe will look at this yaml file from an external dataset(provided in L5kit examples). Let's look the **raster_params** filed. It contains information related to the transformation of the 3D world onto image plane. You can also check for various other information.\n\n## [NOTE]:We can make our own configuration file. ","metadata":{}},{"cell_type":"code","source":"# Raster Parameters\nprint(f'current raster_param:\\n')\nfor k,v in cfg[\"raster_params\"].items():\n    print(f\"{k}:{v}\")","metadata":{"trusted":true,"execution":{"iopub.status.busy":"2025-05-31T01:20:12.951457Z","iopub.execute_input":"2025-05-31T01:20:12.951761Z","iopub.status.idle":"2025-05-31T01:20:12.957049Z","shell.execute_reply.started":"2025-05-31T01:20:12.951738Z","shell.execute_reply":"2025-05-31T01:20:12.95616Z"}},"outputs":[],"execution_count":null},{"cell_type":"markdown","source":"## 3.3 <a id='3-3'>Loading Data</a>\n\n[Table of Contents](#0.1)\n\nWe're building a LocalDataManager object. This will resolve relative paths from the config using the L5KIT_DATA_FOLDER env variable we have just set. We will work with sample.zarr for developing intuition regarding the data. Please use train.zarr, validate.zarr and test.zarr for actual model training, validation and prediction.","metadata":{}},{"cell_type":"code","source":"import yaml\n\n# Paste your YAML as a multiline string\nyaml_config = \"\"\"\n\nmodel_params:\n  model_architecture: \"resnet50\"\n\n  history_num_frames: 0\n  history_step_size: 1\n  history_delta_time: 0.1\n\n  future_num_frames: 50\n  future_step_size: 1\n  future_delta_time: 0.1\n\nraster_params:\n  raster_size: [224, 224]\n  pixel_size: [0.5, 0.5]\n  ego_center: [0.25, 0.5]\n  map_type: \"py_semantic\"\n  satellite_map_key: \"aerial_map/aerial_map.png\"\n  semantic_map_key: \"semantic_map/semantic_map.pb\"\n  dataset_meta_key: \"meta.json\"\n  filter_agents_threshold: 0.5\n\ntrain_data_loader:\n  key: \"scenes/train.zarr\"\n  batch_size: 12\n  shuffle: True\n  num_workers: 16\n\nval_data_loader:\n  key: \"scenes/validate.zarr\"\n  batch_size: 12\n  shuffle: False\n  num_workers: 16\n\nsample_data_loader:\n  key: \"scenes/sample.zarr\"\n  batch_size: 12\n  shuffle: False\n  num_workers: 16\n\ntrain_params:\n  checkpoint_every_n_steps: 10000\n  max_num_steps: 5\n  eval_every_n_steps: 10000\n\"\"\"\n\n# Load the YAML string as a Python dictionary\ncfg = yaml.safe_load(yaml_config)\n\n# Now you can use cfg just like you would if you loaded from a file\nprint(\"Raster parameters:\")\nfor k, v in cfg[\"raster_params\"].items():\n    print(f\"{k}: {v}\")\n","metadata":{"trusted":true,"execution":{"iopub.status.busy":"2025-05-31T01:20:16.010146Z","iopub.execute_input":"2025-05-31T01:20:16.010466Z","iopub.status.idle":"2025-05-31T01:20:16.021609Z","shell.execute_reply.started":"2025-05-31T01:20:16.010442Z","shell.execute_reply":"2025-05-31T01:20:16.0208Z"}},"outputs":[],"execution_count":null},{"cell_type":"code","source":"dm = LocalDataManager()\ndataset_path = dm.require(cfg[\"train_data_loader\"][\"key\"])\nzarr_dataset = ChunkedDataset(dataset_path)\nzarr_dataset.open()\nprint(zarr_dataset)","metadata":{"trusted":true,"execution":{"iopub.status.busy":"2025-05-31T01:20:19.785968Z","iopub.execute_input":"2025-05-31T01:20:19.786283Z","iopub.status.idle":"2025-05-31T01:20:29.964343Z","shell.execute_reply.started":"2025-05-31T01:20:19.786257Z","shell.execute_reply":"2025-05-31T01:20:29.962316Z"}},"outputs":[],"execution_count":null},{"cell_type":"code","source":"dm = LocalDataManager()\ndataset_path = dm.require(cfg[\"val_data_loader\"][\"key\"])\nzarr_dataset = ChunkedDataset(dataset_path)\nzarr_dataset.open()\nprint(zarr_dataset)","metadata":{"trusted":true,"execution":{"iopub.status.busy":"2025-05-31T01:11:48.489013Z","iopub.execute_input":"2025-05-31T01:11:48.489293Z","iopub.status.idle":"2025-05-31T01:11:52.350097Z","shell.execute_reply.started":"2025-05-31T01:11:48.48926Z","shell.execute_reply":"2025-05-31T01:11:52.34753Z"}},"outputs":[],"execution_count":null},{"cell_type":"code","source":"dm = LocalDataManager()\ndataset_path = dm.require(cfg[\"sample_data_loader\"][\"key\"])\nzarr_dataset = ChunkedDataset(dataset_path)\nzarr_dataset.open()\nprint(zarr_dataset)","metadata":{"trusted":true,"execution":{"iopub.status.busy":"2025-05-31T01:20:33.482279Z","iopub.execute_input":"2025-05-31T01:20:33.482603Z","iopub.status.idle":"2025-05-31T01:20:33.773648Z","shell.execute_reply.started":"2025-05-31T01:20:33.482577Z","shell.execute_reply":"2025-05-31T01:20:33.772661Z"}},"outputs":[],"execution_count":null},{"cell_type":"code","source":"print(dataset_path)","metadata":{"trusted":true,"execution":{"iopub.status.busy":"2025-05-31T01:21:37.531915Z","iopub.execute_input":"2025-05-31T01:21:37.532244Z","iopub.status.idle":"2025-05-31T01:21:37.536389Z","shell.execute_reply.started":"2025-05-31T01:21:37.532204Z","shell.execute_reply":"2025-05-31T01:21:37.535516Z"}},"outputs":[],"execution_count":null},{"cell_type":"markdown","source":"We are going to load our sample.zarr file. The 2020 Lyft competition dataset is stored in four structured arrays: **scenes, frames, agents and tl_faces**. ","metadata":{}},{"cell_type":"markdown","source":"## 3.4 <a id='3-4'>Data Overview</a>\n\n[Table of Contents](#0.1)\n\nWe will see each field inside the zarr files. (train, validation and test). We will use **sample.zarr** here. ","metadata":{}},{"cell_type":"markdown","source":"### 3.4.1 <a id='3-4-1'>Agents</a>\n\nAn agent is an observation by the AV of some other detected object. Each entry describes the object in terms of its attributes such as position and velocity, gives the agent a tracking number to track it over multiple frames (but only within the same scene!) and its most probable label.","metadata":{}},{"cell_type":"code","source":"agents = pd.DataFrame.from_records(zarr_dataset.agents, columns = ['centroid', 'extent', 'yaw', 'velocity', 'track_id', 'label_probabilities'])\nagents.head()","metadata":{"trusted":true,"_kg_hide-input":true,"execution":{"iopub.status.busy":"2025-05-31T01:21:39.165003Z","iopub.execute_input":"2025-05-31T01:21:39.165323Z","iopub.status.idle":"2025-05-31T01:21:50.530208Z","shell.execute_reply.started":"2025-05-31T01:21:39.165297Z","shell.execute_reply":"2025-05-31T01:21:50.529378Z"}},"outputs":[],"execution_count":null},{"cell_type":"markdown","source":"**📌 Points to note :**\n   * **centroid** - position of agent\n   * **extent** - agent dimension\n   * **yaw** - rotation of an agent with respect to vertical axis. A yaw rotation is a movement around the yaw axis of a rigid body that changes the direction it is pointing, to the left or right of its direction of motion.\n   * **velocity** - speed of the agent \n   * **track_id** - unique id to track agent in different frames\n   * **label_probabilities** - prabability an agent belong to one of the 17 classes. (We are only given three labels [cyclist, pedestrians and cars])","metadata":{}},{"cell_type":"markdown","source":"### Centroid Distribution","metadata":{}},{"cell_type":"markdown","source":"We will see the distribution of centroid now. Since **centroid** column consist of list per sample we will make two new columns **centroid_x** and **centroid_y**.","metadata":{}},{"cell_type":"code","source":"agents[['centroid_x','centroid_y']] = agents['centroid'].to_list()\nagents = agents.drop('centroid', axis=1)\nagents_new = agents[[\"centroid_x\", \"centroid_y\", \"extent\", \"yaw\", \"velocity\", \"track_id\", \"label_probabilities\"]]\ndel agents\nagents_new","metadata":{"_kg_hide-input":true,"trusted":true,"execution":{"iopub.status.busy":"2025-05-31T01:21:50.532413Z","iopub.execute_input":"2025-05-31T01:21:50.532763Z","iopub.status.idle":"2025-05-31T01:21:54.065982Z","shell.execute_reply.started":"2025-05-31T01:21:50.532725Z","shell.execute_reply":"2025-05-31T01:21:54.065254Z"}},"outputs":[],"execution_count":null},{"cell_type":"code","source":"fig, ax = plt.subplots(1,1,figsize=(8,8))\nplt.scatter(agents_new['centroid_x'], agents_new['centroid_y'], marker='+')\nplt.xlabel('x', fontsize=11); plt.ylabel('y', fontsize=11)\nplt.title(\"Centroids distribution (sample.zarr)\")\nplt.show()","metadata":{"_kg_hide-input":true,"trusted":true,"execution":{"iopub.status.busy":"2025-05-31T01:21:54.067077Z","iopub.execute_input":"2025-05-31T01:21:54.067348Z","iopub.status.idle":"2025-05-31T01:21:55.655041Z","shell.execute_reply.started":"2025-05-31T01:21:54.067321Z","shell.execute_reply":"2025-05-31T01:21:55.654256Z"}},"outputs":[],"execution_count":null},{"cell_type":"markdown","source":"### Extent Distribution\n\nFirst we need to make new columns for extent_x, extent_y and extent_z as we have one **extent** column.","metadata":{}},{"cell_type":"code","source":"agents_new[['extent_x','extent_y', 'extent_z']] = agents_new['extent'].to_list()\nagents_new = agents_new.drop('extent', axis=1)\nagents = agents_new[[\"centroid_x\", \"centroid_y\", 'extent_x', 'extent_y', 'extent_z', \"yaw\", \"velocity\", \"track_id\", \"label_probabilities\"]]\ndel agents_new\nagents","metadata":{"_kg_hide-input":true,"trusted":true,"execution":{"iopub.status.busy":"2025-05-31T01:21:55.656676Z","iopub.execute_input":"2025-05-31T01:21:55.657028Z","iopub.status.idle":"2025-05-31T01:21:59.374324Z","shell.execute_reply.started":"2025-05-31T01:21:55.656989Z","shell.execute_reply":"2025-05-31T01:21:59.373495Z"}},"outputs":[],"execution_count":null},{"cell_type":"code","source":"sns.axes_style(\"white\")\n\nfig, ax = plt.subplots(1,3,figsize=(16,5))\n\nplt.subplot(1,3,1)\nsns.kdeplot(agents['extent_x'], shade=True, color='red');\nplt.title(\"Extent_x distribution\")\n\nplt.subplot(1,3,2)\nsns.kdeplot(agents['extent_y'], shade=True, color='steelblue');\nplt.title(\"Extent_y distribution\")\n\nplt.subplot(1,3,3)\nsns.kdeplot(agents['extent_z'], shade=True, color='green');\nplt.title(\"Extent_z distribution\")\n\nplt.show();","metadata":{"_kg_hide-input":true,"trusted":true,"execution":{"iopub.status.busy":"2025-05-31T01:21:59.376819Z","iopub.execute_input":"2025-05-31T01:21:59.377217Z","iopub.status.idle":"2025-05-31T01:22:01.215212Z","shell.execute_reply.started":"2025-05-31T01:21:59.377159Z","shell.execute_reply":"2025-05-31T01:22:01.214255Z"}},"outputs":[],"execution_count":null},{"cell_type":"markdown","source":"**📌 Points to note :**\n   * We can see extent distributions are **right skewed**.\n   * We can see long tails in positive direction.","metadata":{}},{"cell_type":"markdown","source":"### Extent Distribution: Scatterplot","metadata":{}},{"cell_type":"code","source":"sns.set_style('whitegrid')\n\nfig, ax = plt.subplots(1,3,figsize=(16,5))\nplt.subplot(1,3,1)\nplt.scatter(agents['extent_x'], agents['extent_y'], marker='*')\nplt.xlabel('ex', fontsize=11); plt.ylabel('ey', fontsize=11)\nplt.title(\"Extent: ex-ey\")\n\nplt.subplot(1,3,2)\nplt.scatter(agents['extent_y'], agents['extent_z'], marker='*', color=\"red\")\nplt.xlabel('ey', fontsize=11); plt.ylabel('ez', fontsize=11)\nplt.title(\"Extent: ey-ez\")\n\nplt.subplot(1,3,3)\nplt.scatter(agents['extent_z'], agents['extent_x'], marker='*', color=\"green\")\nplt.xlabel('ez', fontsize=11); plt.ylabel('ex', fontsize=11)\nplt.title(\"Extent: ez-ex\")\n\nplt.show();","metadata":{"_kg_hide-input":true,"trusted":true,"execution":{"iopub.status.busy":"2025-05-31T01:22:09.9141Z","iopub.execute_input":"2025-05-31T01:22:09.914333Z","iopub.status.idle":"2025-05-31T01:22:18.456834Z","shell.execute_reply.started":"2025-05-31T01:22:09.914311Z","shell.execute_reply":"2025-05-31T01:22:18.456041Z"}},"outputs":[],"execution_count":null},{"cell_type":"markdown","source":"### Yaw Distribution","metadata":{}},{"cell_type":"code","source":"fig, ax = plt.subplots(1,1,figsize=(10,8))\nsns.distplot(agents['yaw'])\nplt.title(\"Yaw Distribution\")\nplt.show()","metadata":{"_kg_hide-input":true,"trusted":true,"execution":{"iopub.status.busy":"2025-05-31T01:22:18.458435Z","iopub.execute_input":"2025-05-31T01:22:18.458689Z","iopub.status.idle":"2025-05-31T01:22:19.513183Z","shell.execute_reply.started":"2025-05-31T01:22:18.458662Z","shell.execute_reply":"2025-05-31T01:22:19.512138Z"}},"outputs":[],"execution_count":null},{"cell_type":"markdown","source":"### Velocity Distribution","metadata":{}},{"cell_type":"code","source":"agents[['velocity_x','velocity_y']] = agents['velocity'].to_list()\nagents_vel = agents.drop('velocity', axis=1)\nagents_v = agents_vel[[\"centroid_x\", \"centroid_y\", 'extent_x', 'extent_y', 'extent_z', \"yaw\", \"velocity_x\", \"velocity_y\", \"track_id\", \"label_probabilities\"]]\ndel agents\nagents_v","metadata":{"_kg_hide-input":true,"trusted":true,"execution":{"iopub.status.busy":"2025-05-31T01:23:51.357634Z","iopub.execute_input":"2025-05-31T01:23:51.357932Z","iopub.status.idle":"2025-05-31T01:23:51.37359Z","shell.execute_reply.started":"2025-05-31T01:23:51.357907Z","shell.execute_reply":"2025-05-31T01:23:51.372539Z"}},"outputs":[],"execution_count":null},{"cell_type":"code","source":"fig, ax = plt.subplots(1,1,figsize=(10,8))\n\nwith sns.axes_style(\"whitegrid\"):\n    sns.scatterplot(x=agents_v[\"velocity_x\"], y=agents_v[\"velocity_y\"], color='k');\n    plt.title('Velocity Distribution')","metadata":{"_kg_hide-input":true,"trusted":true,"execution":{"iopub.status.busy":"2025-05-31T01:23:52.380171Z","iopub.execute_input":"2025-05-31T01:23:52.380516Z","iopub.status.idle":"2025-05-31T01:23:56.081795Z","shell.execute_reply.started":"2025-05-31T01:23:52.380489Z","shell.execute_reply":"2025-05-31T01:23:56.080805Z"}},"outputs":[],"execution_count":null},{"cell_type":"code","source":"agents = zarr_dataset.agents\nprobabilities = agents[\"label_probabilities\"]\nlabels_indexes = np.argmax(probabilities, axis=1)\ncounts = []\nfor idx_label, label in enumerate(PERCEPTION_LABELS):\n    counts.append(np.sum(labels_indexes == idx_label))\n    \ntable = PrettyTable(field_names=[\"label\", \"counts\"])\nfor count, label in zip(counts, PERCEPTION_LABELS):\n    table.add_row([label, count])\nprint(table)","metadata":{"_kg_hide-input":true,"trusted":true,"execution":{"iopub.status.busy":"2025-05-31T01:24:02.413831Z","iopub.execute_input":"2025-05-31T01:24:02.414139Z","iopub.status.idle":"2025-05-31T01:24:02.622036Z","shell.execute_reply.started":"2025-05-31T01:24:02.414113Z","shell.execute_reply":"2025-05-31T01:24:02.621086Z"}},"outputs":[],"execution_count":null},{"cell_type":"markdown","source":"As we can see indeed there are only four types of agents provided in the dataset such as Cars, Cyclists, Pedestrians and Unknown. We can see that **Unknown** label is more as compared to other three agent labels. ","metadata":{}},{"cell_type":"code","source":"print(f'{Fore.YELLOW}Total number of agents in sample .zarr files is {Style.RESET_ALL}{len(zarr_dataset.agents)}. {Fore.BLUE}\\nAfter summing up the elements in count column we can see we have {Style.RESET_ALL}{(1324481 + 519385 + 6688 + 43182)} {Fore.BLUE}agents in total.')","metadata":{"_kg_hide-input":true,"trusted":true,"execution":{"iopub.status.busy":"2025-05-31T01:24:06.124766Z","iopub.execute_input":"2025-05-31T01:24:06.12506Z","iopub.status.idle":"2025-05-31T01:24:06.129696Z","shell.execute_reply.started":"2025-05-31T01:24:06.125034Z","shell.execute_reply":"2025-05-31T01:24:06.128764Z"}},"outputs":[],"execution_count":null},{"cell_type":"markdown","source":"### 3.4.2 <a id='3-4-2'>Scenes</a>\n[Table of contents](#0.1)\n\nA scene is identified by the host (i.e. which car was used to collect it) and a start and end time. It consists of multiple frames (=snapshots at discretized time intervals). The scene datatype stores references to its corresponding frames in terms of the start and end index within the frames array (described in dataframe below). The frames in between these indices all correspond to the scene (including start index, excluding end index).","metadata":{}},{"cell_type":"code","source":"scenes = pd.DataFrame.from_records(zarr_dataset.scenes, columns = ['frame_index_interval', 'host', 'start_time', 'end_time'])\nscenes.head()","metadata":{"trusted":true,"_kg_hide-input":true,"execution":{"iopub.status.busy":"2025-05-31T01:24:09.135507Z","iopub.execute_input":"2025-05-31T01:24:09.135833Z","iopub.status.idle":"2025-05-31T01:24:09.156585Z","shell.execute_reply.started":"2025-05-31T01:24:09.135801Z","shell.execute_reply":"2025-05-31T01:24:09.155761Z"}},"outputs":[],"execution_count":null},{"cell_type":"markdown","source":"**📌 Points to note :**\n   * **frame_index_interval** - frame index (including start index, excluding end index)\n   * **host** - car used to collect data\n   * **start_time** - start time of scene\n   * **end_time** - end time of scene","metadata":{}},{"cell_type":"markdown","source":"### Frame Index","metadata":{}},{"cell_type":"code","source":"scenes[['frame_start_index','frame_end_index']] = scenes['frame_index_interval'].to_list()\nscenes_new = scenes.drop('frame_index_interval', axis=1)\nscenes_new = scenes_new[[\"frame_start_index\", \"frame_end_index\", 'host', 'start_time', 'end_time']]\ndel scenes\nscenes_new.head()","metadata":{"_kg_hide-input":false,"trusted":true,"execution":{"iopub.status.busy":"2025-05-31T01:24:11.9843Z","iopub.execute_input":"2025-05-31T01:24:11.984605Z","iopub.status.idle":"2025-05-31T01:24:11.999942Z","shell.execute_reply.started":"2025-05-31T01:24:11.984581Z","shell.execute_reply":"2025-05-31T01:24:11.998983Z"}},"outputs":[],"execution_count":null},{"cell_type":"code","source":"f = plt.figure(figsize=(10, 8))\ngs = f.add_gridspec(1, 2)\n\nwith sns.axes_style(\"whitegrid\"):\n    ax = f.add_subplot(gs[0,0])\n    sns.scatterplot(scenes_new['frame_start_index'], scenes_new['frame_end_index'])\n    plt.title('Frame Index Interval Distribution')\n    \nwith sns.axes_style(\"whitegrid\"):\n    ax = f.add_subplot(gs[0,1])\n    sns.scatterplot(scenes_new['frame_start_index'], scenes_new['frame_end_index'], hue=scenes_new['host'])\n    plt.title('Frame Index Interval Distribution (Grouped per host)')\n    \nf.tight_layout()","metadata":{"_kg_hide-input":true,"trusted":true,"execution":{"iopub.status.busy":"2025-05-31T01:24:14.748682Z","iopub.execute_input":"2025-05-31T01:24:14.748974Z","iopub.status.idle":"2025-05-31T01:24:15.495177Z","shell.execute_reply.started":"2025-05-31T01:24:14.748951Z","shell.execute_reply":"2025-05-31T01:24:15.494322Z"}},"outputs":[],"execution_count":null},{"cell_type":"markdown","source":"**📌 Points to note :**\n   * We can see linear trend here.\n   * Both host cars collected data within particular time intervals.","metadata":{}},{"cell_type":"markdown","source":"### Host Count\n\nWe will now see the host counts (Ego vehicle used to collect the data).","metadata":{}},{"cell_type":"code","source":"f = plt.figure(figsize=(10, 8))\n\nwith sns.axes_style(\"white\"):\n    sns.countplot(scenes_new['host']);\n    plt.title(\"Host Count\")","metadata":{"trusted":true,"_kg_hide-input":true,"execution":{"iopub.status.busy":"2025-05-31T01:24:18.588703Z","iopub.execute_input":"2025-05-31T01:24:18.588999Z","iopub.status.idle":"2025-05-31T01:24:18.703063Z","shell.execute_reply.started":"2025-05-31T01:24:18.588976Z","shell.execute_reply":"2025-05-31T01:24:18.702156Z"}},"outputs":[],"execution_count":null},{"cell_type":"markdown","source":"**📌 Points to note :**\n   * We have two host cars which were used to collect the data **\"host-a013\"** and **\"host-a101\"**.","metadata":{}},{"cell_type":"markdown","source":"### 3.4.3 <a id='3-4-3'>Frames</a>\n[Table of contents](#0.1)\n\nA frame captures all information that was observed at a time. This includes the following fields as mentioned in dataframe below.","metadata":{}},{"cell_type":"code","source":"frames = pd.DataFrame.from_records(zarr_dataset.frames, columns = ['timestamp', 'agent_index_interval', 'traffic_light_faces_index_interval', 'ego_translation','ego_rotation'])\nframes.head()","metadata":{"trusted":true,"_kg_hide-input":true,"execution":{"iopub.status.busy":"2025-05-31T01:24:21.970175Z","iopub.execute_input":"2025-05-31T01:24:21.970515Z","iopub.status.idle":"2025-05-31T01:24:22.112435Z","shell.execute_reply.started":"2025-05-31T01:24:21.970489Z","shell.execute_reply":"2025-05-31T01:24:22.111721Z"}},"outputs":[],"execution_count":null},{"cell_type":"markdown","source":"**📌 Points to note :**\n   * **timestamp** - frame's timestamp\n   * **agent_index_interval** - agents (vehicles, cyclists and pedestrians) that were captured by the ego's sensors\n   * **traffic_light_faces_index_interval** - traffic light index\n   * **ego_translation** - position of host car.\n   * **ego_rotation** - rotation of host car (which is collecting data using ego sensors)","metadata":{}},{"cell_type":"markdown","source":"### Ego Translation Distribution","metadata":{}},{"cell_type":"code","source":"frames[['ego_translation_x', 'ego_translation_y', 'ego_translation_z']] = frames['ego_translation'].to_list()\nframes_new = frames.drop('ego_translation', axis=1)\nframes_new = frames_new[['timestamp', 'agent_index_interval', 'traffic_light_faces_index_interval',\n                         'ego_translation_x', 'ego_translation_y', 'ego_translation_z', 'ego_rotation']]\ndel frames\nframes_new.head()","metadata":{"_kg_hide-input":true,"trusted":true,"execution":{"iopub.status.busy":"2025-05-31T01:24:25.120705Z","iopub.execute_input":"2025-05-31T01:24:25.121016Z","iopub.status.idle":"2025-05-31T01:24:25.210521Z","shell.execute_reply.started":"2025-05-31T01:24:25.120986Z","shell.execute_reply":"2025-05-31T01:24:25.20957Z"}},"outputs":[],"execution_count":null},{"cell_type":"code","source":"f = plt.figure(figsize=(16, 8))\ngs = f.add_gridspec(1, 3)\n\nwith sns.axes_style(\"whitegrid\"):\n    ax = f.add_subplot(gs[0,0])\n    sns.distplot(frames_new['ego_translation_x'], color='Orange')\n    plt.title('Ego Translation Distribution X')\n    \nwith sns.axes_style(\"whitegrid\"):\n    ax = f.add_subplot(gs[0,1])\n    sns.distplot(frames_new['ego_translation_y'], color='Red')\n    plt.title('Ego Translation Distribution Y')\n    \nwith sns.axes_style(\"whitegrid\"):\n    ax = f.add_subplot(gs[0,2])\n    sns.distplot(frames_new['ego_translation_z'], color='Green')\n    plt.title('Ego Translation Distribution Z')\n    \nf.tight_layout()","metadata":{"_kg_hide-input":true,"trusted":true,"execution":{"iopub.status.busy":"2025-05-31T01:24:28.077268Z","iopub.execute_input":"2025-05-31T01:24:28.077581Z","iopub.status.idle":"2025-05-31T01:24:29.134515Z","shell.execute_reply.started":"2025-05-31T01:24:28.077554Z","shell.execute_reply":"2025-05-31T01:24:29.133623Z"}},"outputs":[],"execution_count":null},{"cell_type":"markdown","source":"**📌 Points to note :**\n   * We can see the distributions are multi-models here.","metadata":{}},{"cell_type":"markdown","source":"### Ego Translation Scatterplot","metadata":{}},{"cell_type":"code","source":"f = plt.figure(figsize=(16, 6))\ngs = f.add_gridspec(1, 3)\n\nwith sns.axes_style(\"darkgrid\"):\n    ax = f.add_subplot(gs[0,0])\n    plt.scatter(frames_new['ego_translation_x'], frames_new['ego_translation_y'],\n                    color='darkkhaki', marker='+')\n    plt.title('Ego Translation X-Y')\n    plt.xlabel('ego_translation_x')\n    plt.ylabel('ego_translation_y')\n    \nwith sns.axes_style(\"darkgrid\"):\n    ax = f.add_subplot(gs[0,1])\n    plt.scatter(frames_new['ego_translation_y'], frames_new['ego_translation_z'],\n                    color='slateblue', marker='*')\n    plt.title('Ego Translation Distribution Y-Z')\n    plt.xlabel('ego_translation_y')\n    plt.ylabel('ego_translation_z')\n    \nwith sns.axes_style(\"darkgrid\"):\n    ax = f.add_subplot(gs[0,2])\n    plt.scatter(frames_new['ego_translation_z'], frames_new['ego_translation_x'],\n                    color='turquoise', marker='^')\n    plt.title('Ego Translation Distribution Z-X')\n    plt.xlabel('ego_translation_z')\n    plt.ylabel('ego_translation_x')\n    \nf.tight_layout()","metadata":{"_kg_hide-input":true,"trusted":true,"execution":{"iopub.status.busy":"2025-05-31T01:24:31.837641Z","iopub.execute_input":"2025-05-31T01:24:31.837965Z","iopub.status.idle":"2025-05-31T01:24:32.739603Z","shell.execute_reply.started":"2025-05-31T01:24:31.837934Z","shell.execute_reply":"2025-05-31T01:24:32.738781Z"}},"outputs":[],"execution_count":null},{"cell_type":"markdown","source":"### Ego Rotations Distribution","metadata":{}},{"cell_type":"code","source":"fig, ax = plt.subplots(3,3,figsize=(16,16))\ncolors = ['red', 'blue', 'green', 'magenta', 'orange', 'darkblue', 'black', 'cyan', 'darkgreen']\nfor i in range(0,3):\n    for j in range(0,3):\n        df = frames_new['ego_rotation'].apply(lambda x: x[i][j])\n        plt.subplot(3,3,i * 3 + j + 1)\n        sns.distplot(df, hist=False, color = colors[ i * 3 + j  ])\n        plt.xlabel(f'r[ {i + 1} ][ {j + 1} ]')\nfig.suptitle(\"Ego rotation angles distribution\", size=14)\nplt.show()","metadata":{"_kg_hide-input":true,"trusted":true,"execution":{"iopub.status.busy":"2025-05-31T01:24:36.781513Z","iopub.execute_input":"2025-05-31T01:24:36.781821Z","iopub.status.idle":"2025-05-31T01:24:38.815874Z","shell.execute_reply.started":"2025-05-31T01:24:36.781797Z","shell.execute_reply":"2025-05-31T01:24:38.815095Z"}},"outputs":[],"execution_count":null},{"cell_type":"markdown","source":"### 3.4.3 <a id='3-4-3'>Traffic Light Faces</a>\n[Table of contents](#0.1)\n\nThe traffic light bulbs (red, green, yellow) are refered as **face**.","metadata":{}},{"cell_type":"code","source":"traffic_light_faces = pd.DataFrame.from_records(zarr_dataset.tl_faces, columns = ['face_id', 'traffic_light_id', 'traffic_light_face_status'])\ntraffic_light_faces.head()","metadata":{"trusted":true,"_kg_hide-input":true,"execution":{"iopub.status.busy":"2025-05-31T01:24:44.22463Z","iopub.execute_input":"2025-05-31T01:24:44.224957Z","iopub.status.idle":"2025-05-31T01:24:45.391105Z","shell.execute_reply.started":"2025-05-31T01:24:44.224926Z","shell.execute_reply":"2025-05-31T01:24:45.390413Z"}},"outputs":[],"execution_count":null},{"cell_type":"markdown","source":"   * **face_id** - unique id for traffic light bulb\n   * **traffic_light_id** - traffic light status\n   * **traffic_light_face_status** - out of red/green/yellow which face is active/unactive/unknown","metadata":{}},{"cell_type":"markdown","source":"## 3.5 <a id='3-5'>Dataset Package</a>\n\n[Table of Contents](#0.1)\n\nThe dataset package, for example, already implements PyTorch ready datasets, so you can hit the ground running and start coding immediately. There are two classes in the dataset package. We will be using below two datasets classes to generate inputs and targets.\n\n   * EgoDataset: this dataset iterates over the AV annotations\n   * AgentDataset: this dataset iterates over other agents annotations\n   \nBoth of them can be iterated and return multi-channel images from the rasterizer along with future trajectories offsets and other information. We will see ahead about **rasterizer and trajectories** soon.\n\nWe need **cfg**, **Zarr-Dataset(ChunkedDataset)** and **rasterizer** object to instantiate these.\n\n### 3.5.1 <a name='3-5-1'>ChunckedDataset</a>\n\n[Table of Contents](#0.1)\n\nThe **[ChunckedDataset](#0.2)**(click) class as you can see above returned four structured arrays, scenes, frames, agents and tl_faces, all are described above in detail. Both the **EgoDataset and AgentDataset** are using **zarr dataset** object which is made using **[ChunckedDataset](#0.2)**. \n","metadata":{}},{"cell_type":"markdown","source":"## 3.6 <a id='3-6'>Visualize Autonomous Vehicle🚙</a>\n\n[Table of Contents](#0.1)\n\nNow we will look into the visualisation utility of [L5Kit Toolkit](https://github.com/lyft/l5kit). There are two core packages for visualisation:\n\n* **rasterization** - contains classes for getting visual data as multi-channel tensors and turning them into interpretable RGB images. We will talk about these classes in detail shortly. Each class inside this [rasterization](https://github.com/lyft/l5kit/tree/master/l5kit/l5kit/rasterization) package conatin has at least a **rasterize** method to get the tensor and a **to_rgb** method to convert it into an image. \n\n    * BoxRasterizer: this object renders agents (e.g. vehicles or pedestrians) as oriented 2D boxes.\n    * StubRasterizer: this object doesn't do anything. It return all black image and can be used for testing.\n    * SatelliteRasterizer: this object renders an oriented crop from a satellite map.\n    * SatBoxRasterizer: this object combine a **Satellite** and a **Box Rasterizers** into a single class. You can visualize agents (e.g. vehicles or pedestrians) as oriented 2D boxes in a satellite image.\n    * SemanticRasterizer: this object renders semantic map which contains lane & crosswalk information.\n    * SemBoxRasterizer: this object combine a **Semantic Map** and a **Box Rasterizers** into a single class. You can visualize agents (e.g. vehicles or pedestrians) as oriented 2D boxes in a semantic image.\n    \nTo instantiate each of these object we will use **build_rasterizer** method.\n   \n   \n* **visualization** - contains utilities to draw additional information (e.g. trajectories) onto RGB images. These utilities are commonly used after a **to_rgb** call to add other information to the final visualisation. Following utilities are available.\n   \n   * draw_arrowed_line: Draw a single arrowed line in an RGB image.\n   * draw_trajectory: Draw a trajectory on oriented arrow onto an RGB image.\n   * draw_reference_trajectory: Draw a trajectory (as points) onto the image.","metadata":{}},{"cell_type":"markdown","source":"### **3.6.1<a id='3-6-1'> Visualizing Various Rasterizer Objects**</a>\n\nWe will visualize different raster objects. [credits](https://www.kaggle.com/corochann/lyft-deep-into-the-l5kit-library#1.-Understanding-Rasterizer-class)\n\n[Table of Contents](#0.1)","metadata":{}},{"cell_type":"code","source":"sns.set_style({'axes.grid': False})\n\ndef visualize_rgb_image(dataset, index, title=\"\", ax=None):\n    \"\"\"Visualizes Rasterizer's RGB image\"\"\"\n    data = dataset[index]\n    im = data[\"image\"].transpose(1, 2, 0)\n    im = dataset.rasterizer.to_rgb(im)\n\n    if ax is None:\n        fig, ax = plt.subplots()\n    if title:\n        ax.set_title(title)\n    ax.imshow(im[::-1])\n# Prepare all rasterizer and EgoDataset for each rasterizer\nrasterizer_dict = {}\ndataset_dict = {}\n\nrasterizer_type_list = [\"py_satellite\", \"satellite_debug\", \"py_semantic\", \"semantic_debug\", \"box_debug\", \"stub_debug\"]\n\nfor i, key in enumerate(rasterizer_type_list):\n    print(\"key\", key)\n    cfg[\"raster_params\"][\"map_type\"] = key\n    rasterizer_dict[key] = build_rasterizer(cfg, dm)\n    dataset_dict[key] = EgoDataset(cfg, zarr_dataset, rasterizer_dict[key])\nfig, axes = plt.subplots(2, 3, figsize=(15, 10))\naxes = axes.flatten()\nfor i, key in enumerate([\"stub_debug\", \"satellite_debug\", \"semantic_debug\", \"box_debug\", \"py_satellite\", \"py_semantic\"]):\n    visualize_rgb_image(dataset_dict[key], index=0, title=f\"{key}: {type(rasterizer_dict[key]).__name__}\", ax=axes[i])\nfig.show()","metadata":{"_kg_hide-input":true,"trusted":true,"execution":{"iopub.status.busy":"2025-05-31T01:24:52.63804Z","iopub.execute_input":"2025-05-31T01:24:52.638396Z","iopub.status.idle":"2025-05-31T01:25:09.021341Z","shell.execute_reply.started":"2025-05-31T01:24:52.638367Z","shell.execute_reply":"2025-05-31T01:25:09.020633Z"}},"outputs":[],"execution_count":null},{"cell_type":"markdown","source":"### 3.6.2 <a id='3-6-2'>Visualize Trajectory: Semantic View</a>\n\n[Table of Contents](#0.1)","metadata":{}},{"cell_type":"code","source":"# Set rasterizer type\ncfg[\"raster_params\"][\"map_type\"] = \"py_semantic\"\n\n# Build rasterizer and EgoDataset\nrast = build_rasterizer(cfg, dm)\ndataset = EgoDataset(cfg, zarr_dataset, rast)\n\n# Select a sample\ndata = dataset[50]\n\n# Convert the rasterized image to RGB for plotting\nim = data[\"image\"].transpose(1, 2, 0)\nim = dataset.rasterizer.to_rgb(im)\n\n# Step 1: Convert target positions from agent to world coordinates\ntarget_positions_world = transform_points(data[\"target_positions\"], data[\"agent_from_world\"])  # agent->world\n\n# Step 2: Convert from world to raster/image coordinates\ntarget_positions_pixels = transform_points(target_positions_world, data[\"raster_from_world\"])  # world->image\n\n# Plot ground truth trajectory\ndraw_trajectory(im, target_positions_pixels, TARGET_POINTS_COLOR, yaws=data[\"target_yaws\"])\n\nplt.rcParams['figure.figsize'] = 10, 10\nplt.title('Ground Truth Trajectory of Autonomous Vehicle', fontsize=15)\nplt.imshow(im)\nplt.show()\n","metadata":{"trusted":true,"execution":{"iopub.status.busy":"2025-05-31T01:25:09.022756Z","iopub.execute_input":"2025-05-31T01:25:09.022978Z","iopub.status.idle":"2025-05-31T01:25:13.238503Z","shell.execute_reply.started":"2025-05-31T01:25:09.022957Z","shell.execute_reply":"2025-05-31T01:25:13.237736Z"}},"outputs":[],"execution_count":null},{"cell_type":"markdown","source":"### 3.6.3 <a id='3-6-3'>Visualize Trajectory: Satellite View</a>\n\n[Table of Contents](#0.1)\n\nWe can get the satellite view by changing the parameter **map_type** inside **raster_params** in our configuration file **cfg**.","metadata":{}},{"cell_type":"code","source":"cfg[\"raster_params\"][\"map_type\"] = \"py_satellite\"\nrast = build_rasterizer(cfg, dm)\n\n# EgoDataset object\ndataset = EgoDataset(cfg, zarr_dataset, rast)\ndata = dataset[50]\n\nim = data[\"image\"].transpose(1, 2, 0)\nim = dataset.rasterizer.to_rgb(im)\ntarget_positions_world = transform_points(data[\"target_positions\"], data[\"agent_from_world\"])  \ntarget_positions_pixels = transform_points(target_positions_world, data[\"raster_from_world\"])  \ndraw_trajectory(im, target_positions_pixels, TARGET_POINTS_COLOR, yaws=data[\"target_yaws\"])\n\nplt.rcParams['figure.figsize'] = 10, 10\nplt.title('Satellite View: Ground Truth Trajectory of Autonomous Vehicle',fontsize=15)\nplt.imshow(im[::-1])\nplt.show()","metadata":{"trusted":true,"_kg_hide-input":true,"execution":{"iopub.status.busy":"2025-05-31T01:14:41.89035Z","iopub.execute_input":"2025-05-31T01:14:41.890699Z","iopub.status.idle":"2025-05-31T01:14:45.770351Z","shell.execute_reply.started":"2025-05-31T01:14:41.890662Z","shell.execute_reply":"2025-05-31T01:14:45.769505Z"}},"outputs":[],"execution_count":null},{"cell_type":"markdown","source":"### 3.6.4 <a id='3-6-4'>Visualize Agent</a>\n\n[Table of Contents](#0.1)\n\nWe will visualize our agents using AgentDataset class. ","metadata":{}},{"cell_type":"code","source":"# AgentDataset object\ndataset = AgentDataset(cfg, zarr_dataset, rast)\ndata = dataset[50]\n\nim = data[\"image\"].transpose(1, 2, 0)\nim = dataset.rasterizer.to_rgb(im)\ntarget_positions_pixels = transform_points(data[\"target_positions\"] + data[\"centroid\"][:2], data[\"world_to_image\"])\ndraw_trajectory(im, target_positions_pixels, TARGET_POINTS_COLOR, yaws=data[\"target_yaws\"])\n\nplt.rcParams['figure.figsize'] = 10, 10\nplt.title('Agent',fontsize=15)\nplt.imshow(im[::-1])\nplt.show()","metadata":{"trusted":true,"_kg_hide-input":true,"execution":{"iopub.status.busy":"2025-05-31T01:14:45.771562Z","iopub.execute_input":"2025-05-31T01:14:45.771878Z","iopub.status.idle":"2025-05-31T01:14:46.594732Z","shell.execute_reply.started":"2025-05-31T01:14:45.771846Z","shell.execute_reply":"2025-05-31T01:14:46.593966Z"}},"outputs":[],"execution_count":null},{"cell_type":"markdown","source":"The **green** box is our AV agent. The **blue** boxes are entities which we are captured by the sensors. We want to predict the motion of these entities so that our AV can more effectively predict its path. ","metadata":{}},{"cell_type":"markdown","source":"### 3.6.5 <a id='3-6-5'>Visualize Individual Scene: Semantic</a>\n\n[Table of Contents](#0.1)\n\nWe will visualize the scene in depth.","metadata":{}},{"cell_type":"code","source":"from IPython.display import display, HTML\nimport PIL\n\ncfg[\"raster_params\"][\"map_type\"] = \"py_semantic\"\nrast = build_rasterizer(cfg, dm)\ndataset = EgoDataset(cfg, zarr_dataset, rast)\nscene_idx = 34\nindexes = dataset.get_scene_indices(scene_idx)\nimages = []\n\nfor idx in indexes:\n    data = dataset[idx]\n    im = data[\"image\"].transpose(1, 2, 0)  # CHW -> HWC\n    im = dataset.rasterizer.to_rgb(im)\n    \n    target_positions_pixels = transform_points(\n        data[\"target_positions\"] + data[\"centroid\"][:2], \n        data[\"world_to_image\"]\n    )\n    \n    draw_trajectory(\n        on_image=im,\n        positions=target_positions_pixels,\n        yaws=data[\"target_yaws\"],\n        rgb_color=TARGET_POINTS_COLOR,\n        radius=1\n    )\n    \n    # Remove this line to keep previous outputs:\n    # clear_output(wait=True)\n\n    # Keep image orientation normal (no vertical flip):\n    images.append(PIL.Image.fromarray(im))  # No im[::-1]\n\n# animation\nanim = animate_solution(images)\ndisplay(HTML(anim.to_jshtml()))\n","metadata":{"trusted":true,"_kg_hide-input":true,"execution":{"iopub.status.busy":"2025-05-31T01:30:59.103673Z","iopub.execute_input":"2025-05-31T01:30:59.103973Z"}},"outputs":[],"execution_count":null},{"cell_type":"markdown","source":"* The green box is our AV agent and the arrow on top of it represent its motion. \n* The blue boxes are agents (cars, cyclists, predestrians).\n* We can see intersection of roads.\n* In animation we can see the AV is moving on straight path.","metadata":{}},{"cell_type":"markdown","source":"### 3.6.6 <a id='3-6-6'>Visualize Individual Scene: Satellite</a>\n\n[Table of Contents](#0.1)\n\nWe are now going to visualize the satellite view for more detailed understanding.","metadata":{}},{"cell_type":"code","source":"from IPython.display import display, HTML\nimport PIL\nimport numpy as np\nimport cv2\n\n# ✅ Safe override of draw_trajectory to avoid np.int error\ndef draw_trajectory(on_image, positions, yaws=None, rgb_color=(255, 0, 0), radius=1):\n    for pos in positions:\n        pred_waypoint = pos[:2]\n        # 🔧 Replaced deprecated np.int with int\n        cv2.circle(on_image, tuple(pred_waypoint.astype(int)), radius, rgb_color, -1)\n\n# 🚀 Satellite view setup\ncfg[\"raster_params\"][\"map_type\"] = \"py_satellite\"\nrast = build_rasterizer(cfg, dm)\ndataset = EgoDataset(cfg, zarr_dataset, rast)\n\nscene_idx = 34\nindexes = dataset.get_scene_indices(scene_idx)\nimages = []\n\nfor idx in indexes:\n    data = dataset[idx]\n    \n    # Convert CHW to HWC for image display\n    im = data[\"image\"].transpose(1, 2, 0)\n    im = dataset.rasterizer.to_rgb(im)\n\n    # Transform target positions to pixel coordinates\n    target_positions_pixels = transform_points(\n        data[\"target_positions\"] + data[\"centroid\"][:2],\n        data[\"world_to_image\"]\n    )\n\n    # ✅ Draw trajectory without flipping image or clearing output\n    draw_trajectory(im, target_positions_pixels, data[\"target_yaws\"], TARGET_POINTS_COLOR)\n\n    # ✅ Do not flip image unless necessary\n    images.append(PIL.Image.fromarray(im))\n\n# 🎞️ Generate animation\nanim = animate_solution(images)\ndisplay(HTML(anim.to_jshtml()))\n","metadata":{"trusted":true,"execution":{"iopub.status.busy":"2025-05-31T01:41:34.822425Z","iopub.execute_input":"2025-05-31T01:41:34.822758Z"}},"outputs":[],"execution_count":null},{"cell_type":"code","source":"# satellite view\ncfg[\"raster_params\"][\"map_type\"] = \"py_satellite\"\nrast = build_rasterizer(cfg, dm)\ndataset = EgoDataset(cfg, zarr_dataset, rast)\nscene_idx = 34\nindexes = dataset.get_scene_indices(scene_idx)\nimages = []\n\nfor idx in indexes:\n    \n    data = dataset[idx]\n    im = data[\"image\"].transpose(1, 2, 0)\n    im = dataset.rasterizer.to_rgb(im)\n    target_positions_pixels = transform_points(data[\"target_positions\"] + data[\"centroid\"][:2], data[\"world_to_image\"])\n    center_in_pixels = np.asarray(cfg[\"raster_params\"][\"ego_center\"]) * cfg[\"raster_params\"][\"raster_size\"]\n    draw_trajectory(im, target_positions_pixels, data[\"target_yaws\"], TARGET_POINTS_COLOR)\n    clear_output(wait=True)\n    images.append(PIL.Image.fromarray(im[::-1]))\n    \n# animation    \nanim = animate_solution(images)\nHTML(anim.to_jshtml())","metadata":{"trusted":true,"_kg_hide-input":true,"execution":{"iopub.status.busy":"2025-05-31T01:38:41.797894Z","iopub.execute_input":"2025-05-31T01:38:41.798212Z","iopub.status.idle":"2025-05-31T01:38:45.164721Z","shell.execute_reply.started":"2025-05-31T01:38:41.798172Z","shell.execute_reply":"2025-05-31T01:38:45.161518Z"}},"outputs":[],"execution_count":null},{"cell_type":"markdown","source":"* We can see the green AV agent and blue entities (cars, bicycles and pedestrians).\n* We can see our agent in motion in realtion to the movement of other agents (vehicles).","metadata":{}},{"cell_type":"code","source":"gc.collect()","metadata":{"trusted":true,"execution":{"iopub.status.busy":"2025-05-31T01:11:52.39817Z","iopub.status.idle":"2025-05-31T01:11:52.398576Z","shell.execute_reply":"2025-05-31T01:11:52.398385Z"}},"outputs":[],"execution_count":null},{"cell_type":"markdown","source":"# 4. <a id='4'>Pytorch Baseline🔦</a>\n\n[Table of Contents](#0.1)\n\n## 4.1 <a id='4-1'>Configuration</a>\n\nLet us first make our configurations for training and testing then we will load our data.","metadata":{}},{"cell_type":"code","source":"DEBUG = True\n\n# training cfg\ntraining_cfg = {\n    \n    'format_version': 4,\n    \n     ## Model options\n    'model_params': {\n        'model_architecture': 'resnet34',\n        'history_num_frames': 10,\n        'history_step_size': 1,\n        'history_delta_time': 0.1,\n        'future_num_frames': 50,\n        'future_step_size': 1,\n        'future_delta_time': 0.1,\n    },\n\n    ## Input raster parameters\n    'raster_params': {\n        \n        'raster_size': [224, 224], # raster's spatial resolution [meters per pixel]: the size in the real world one pixel corresponds to.\n        'pixel_size': [0.5, 0.5], # From 0 to 1 per axis, [0.5,0.5] would show the ego centered in the image.\n        'ego_center': [0.25, 0.5],\n        'map_type': \"py_semantic\",\n        \n        # the keys are relative to the dataset environment variable\n        'satellite_map_key': \"aerial_map/aerial_map.png\",\n        'semantic_map_key': \"semantic_map/semantic_map.pb\",\n        'dataset_meta_key': \"meta.json\",\n\n        # e.g. 0.0 include every obstacle, 0.5 show those obstacles with >0.5 probability of being\n        # one of the classes we care about (cars, bikes, peds, etc.), >=1.0 filter all other agents.\n        'filter_agents_threshold': 0.5\n    },\n\n    ## Data loader options\n    'train_data_loader': {\n        'key': \"scenes/train.zarr\",\n        'batch_size': 12,\n        'shuffle': True,\n        'num_workers': 4\n    },\n\n    ## Train params\n    'train_params': {\n        'checkpoint_every_n_steps': 5000,\n        'max_num_steps': 100 if DEBUG else 10000\n    }\n}\n\n# inference cfg\ninference_cfg = {\n    \n    'format_version': 4,\n    'model_params': {\n        'history_num_frames': 10,\n        'history_step_size': 1,\n        'history_delta_time': 0.1,\n        'future_num_frames': 50,\n        'future_step_size': 1,\n        'future_delta_time': 0.1\n    },\n    \n    'raster_params': {\n        'raster_size': [300, 300],\n        'pixel_size': [0.5, 0.5],\n        'ego_center': [0.25, 0.5],\n        'map_type': 'py_semantic',\n        'satellite_map_key': 'aerial_map/aerial_map.png',\n        'semantic_map_key': 'semantic_map/semantic_map.pb',\n        'dataset_meta_key': 'meta.json',\n        'filter_agents_threshold': 0.5\n    },\n    \n    'test_data_loader': {\n        'key': 'scenes/test.zarr',\n        'batch_size': 8,\n        'shuffle': False,\n        'num_workers': 4\n    }\n\n}","metadata":{"trusted":true,"execution":{"iopub.status.busy":"2025-05-31T01:45:23.449833Z","iopub.execute_input":"2025-05-31T01:45:23.450151Z","iopub.status.idle":"2025-05-31T01:45:23.458887Z","shell.execute_reply.started":"2025-05-31T01:45:23.450124Z","shell.execute_reply":"2025-05-31T01:45:23.458038Z"}},"outputs":[],"execution_count":null},{"cell_type":"markdown","source":"## 4.2 <a id='4-2'>Loading Training Data</a>\n\n[Table of Contents](#0.1)","metadata":{}},{"cell_type":"code","source":"# root directory\nDIR_INPUT = \"/kaggle/input/lyft-motion-prediction-autonomous-vehicles\"\n\n#submission\nSINGLE_MODE_SUBMISSION = f\"{DIR_INPUT}/single_mode_sample_submission.csv\"\nMULTI_MODE_SUBMISSION = f\"{DIR_INPUT}/multi_mode_sample_submission.csv\"\n\n# set env variable for data\nos.environ[\"L5KIT_DATA_FOLDER\"] = DIR_INPUT\ndm = LocalDataManager(None)\nprint(training_cfg)","metadata":{"trusted":true,"execution":{"iopub.status.busy":"2025-05-31T01:46:27.768936Z","iopub.execute_input":"2025-05-31T01:46:27.769292Z","iopub.status.idle":"2025-05-31T01:46:27.774322Z","shell.execute_reply.started":"2025-05-31T01:46:27.769242Z","shell.execute_reply":"2025-05-31T01:46:27.77352Z"}},"outputs":[],"execution_count":null},{"cell_type":"markdown","source":"## 4.3 <a id='4-3'>Training DataLoader</a>\n\n[Table of Contents](#0.1)\n","metadata":{}},{"cell_type":"code","source":"# training cfg\ntrain_cfg = training_cfg[\"train_data_loader\"]\n\n# rasterizer\nrasterizer = build_rasterizer(training_cfg, dm)\n\n# dataloader\ntrain_zarr = ChunkedDataset(dm.require(train_cfg[\"key\"])).open()\ntrain_dataset = AgentDataset(training_cfg, train_zarr, rasterizer)\ntrain_dataloader = DataLoader(train_dataset, shuffle=train_cfg[\"shuffle\"], batch_size=train_cfg[\"batch_size\"], \n                             num_workers=train_cfg[\"num_workers\"])\nprint(train_dataset)","metadata":{"trusted":true,"execution":{"iopub.status.busy":"2025-05-31T01:46:32.328541Z","iopub.execute_input":"2025-05-31T01:46:32.328824Z","iopub.status.idle":"2025-05-31T01:52:20.357101Z","shell.execute_reply.started":"2025-05-31T01:46:32.328802Z","shell.execute_reply":"2025-05-31T01:52:20.356305Z"}},"outputs":[],"execution_count":null},{"cell_type":"markdown","source":"## 4.4 <a id='4-4'>Model: resnet50 (Pytorch)</a>\n\n[Table of Contents](#0.1)","metadata":{}},{"cell_type":"markdown","source":"This is for the purpose of demonstration only. You can set [pretrained=True]() and train your model in separate notebook keeping on internet connection for downloading pretrained weights and make inference in separate notebook keeping internet off since subission requires you to turn off your internet connection. I will use my trained weights for making inference.","metadata":{}},{"cell_type":"code","source":"class LyftModel(nn.Module):\n    \n    def __init__(self, cfg):\n        super().__init__()\n        \n        # set pretrained=True while training\n        self.backbone = resnet34(pretrained=False) \n        \n        num_history_channels = (cfg[\"model_params\"][\"history_num_frames\"] + 1) * 2\n        num_in_channels = 3 + num_history_channels\n\n        self.backbone.conv1 = nn.Conv2d(\n            num_in_channels,\n            self.backbone.conv1.out_channels,\n            kernel_size=self.backbone.conv1.kernel_size,\n            stride=self.backbone.conv1.stride,\n            padding=self.backbone.conv1.padding,\n            bias=False,\n        )\n        \n        # This is 512 for resnet18 and resnet34;\n        # And it is 2048 for the other resnets\n        backbone_out_features = 512\n        \n        # X, Y coords for the future positions (output shape: Bx50x2)\n        num_targets = 2 * cfg[\"model_params\"][\"future_num_frames\"]\n\n        # You can add more layers here.\n        self.head = nn.Sequential(\n            # nn.Dropout(0.2),\n            nn.Linear(in_features=backbone_out_features, out_features=4096),\n        )\n\n        self.logit = nn.Linear(4096, out_features=num_targets)\n        \n    def forward(self, x):\n        x = self.backbone.conv1(x)\n        x = self.backbone.bn1(x)\n        x = self.backbone.relu(x)\n        x = self.backbone.maxpool(x)\n\n        x = self.backbone.layer1(x)\n        x = self.backbone.layer2(x)\n        x = self.backbone.layer3(x)\n        x = self.backbone.layer4(x)\n\n        x = self.backbone.avgpool(x)\n        x = torch.flatten(x, 1)\n        \n        x = self.head(x)\n        x = self.logit(x)\n        \n        return x","metadata":{"trusted":true,"execution":{"iopub.status.busy":"2025-05-31T01:52:20.359405Z","iopub.execute_input":"2025-05-31T01:52:20.359767Z","iopub.status.idle":"2025-05-31T01:52:20.370763Z","shell.execute_reply.started":"2025-05-31T01:52:20.359726Z","shell.execute_reply":"2025-05-31T01:52:20.369778Z"}},"outputs":[],"execution_count":null},{"cell_type":"markdown","source":"## 4.5 <a id='4-5'>Compilation</a>\n\n[Table of Contents](#0.1)","metadata":{}},{"cell_type":"code","source":"# compiling model\ndevice = torch.device(\"cuda:0\" if torch.cuda.is_available() else \"cpu\")\nmodel = LyftModel(training_cfg).to(device)\noptimizer = optim.Adam(model.parameters(), lr=1e-3)\ncriterion = nn.MSELoss(reduction=\"none\")","metadata":{"trusted":true,"execution":{"iopub.status.busy":"2025-05-31T01:52:20.37198Z","iopub.execute_input":"2025-05-31T01:52:20.372241Z","iopub.status.idle":"2025-05-31T01:52:24.337968Z","shell.execute_reply.started":"2025-05-31T01:52:20.372182Z","shell.execute_reply":"2025-05-31T01:52:24.337362Z"}},"outputs":[],"execution_count":null},{"cell_type":"code","source":"# get hardware type (CPU, GPU, TPU)\ndevice","metadata":{"trusted":true,"execution":{"iopub.status.busy":"2025-05-31T01:52:24.339393Z","iopub.execute_input":"2025-05-31T01:52:24.339737Z","iopub.status.idle":"2025-05-31T01:52:24.345145Z","shell.execute_reply.started":"2025-05-31T01:52:24.3397Z","shell.execute_reply":"2025-05-31T01:52:24.344512Z"}},"outputs":[],"execution_count":null},{"cell_type":"markdown","source":"## 4.6 <a id='4-6'>Training</a>\n\n[Table of Contents](#0.1)","metadata":{}},{"cell_type":"code","source":"# training loop\ntr_it = iter(train_dataloader)\nprogress_bar = tqdm(range(training_cfg[\"train_params\"][\"max_num_steps\"]))\n\nlosses_train = []\n\nfor _ in progress_bar:\n    try:\n        data = next(tr_it)\n    except StopIteration:\n        tr_it = iter(train_dataloader)\n        data = next(tr_it)\n    model.train()\n    torch.set_grad_enabled(True)\n    \n    # forward pass\n    inputs = data[\"image\"].to(device)\n    target_availabilities = data[\"target_availabilities\"].unsqueeze(-1).to(device)\n    targets = data[\"target_positions\"].to(device)\n    \n    outputs = model(inputs).reshape(targets.shape)\n    loss = criterion(outputs, targets)\n\n    # not all the output steps are valid, but we can filter them out from the loss using availabilities\n    loss = loss * target_availabilities\n    loss = loss.mean()\n    # Backward pass\n    optimizer.zero_grad()\n    loss.backward()\n    optimizer.step()\n\n    losses_train.append(loss.item())\n        \n    progress_bar.set_description(f\"loss: {loss.item()} loss(avg): {np.mean(losses_train)}\")","metadata":{"trusted":true,"execution":{"iopub.status.busy":"2025-05-31T01:52:24.347086Z","iopub.execute_input":"2025-05-31T01:52:24.347362Z","iopub.status.idle":"2025-05-31T01:53:51.745618Z","shell.execute_reply.started":"2025-05-31T01:52:24.347339Z","shell.execute_reply":"2025-05-31T01:53:51.739859Z"}},"outputs":[],"execution_count":null},{"cell_type":"markdown","source":"## 4.7 <a id='4-7'>Saving Model</a>\n\n[Table of Contents](#0.1)","metadata":{}},{"cell_type":"code","source":"# save full trained model\ntorch.save(model.state_dict(), f'model_state_last.pth')","metadata":{"trusted":true,"execution":{"iopub.status.busy":"2025-05-31T01:54:04.381102Z","iopub.execute_input":"2025-05-31T01:54:04.381438Z","iopub.status.idle":"2025-05-31T01:54:04.563152Z","shell.execute_reply.started":"2025-05-31T01:54:04.381407Z","shell.execute_reply":"2025-05-31T01:54:04.562133Z"}},"outputs":[],"execution_count":null},{"cell_type":"markdown","source":"# 5. <a id='5'>Prediction and Results📖</a>\n\n[Table of Contents](#0.1)\n\nBe careful you have turned of your internet connection in order to make submission. Please make separate notebook for the inference. This notebook is for the purpose of demonstration. Train using pretrained resnet weights in one notebook and make inference using another notebook.\n\nInference: Trained using Google Colab\n* Model: Single mode baseline (resnet18)\n* Steps: Trained for 30000 iterations (batch 16)\n* Size: Input size 300px, history 1s (10 frames)\n* Optimizer: Adam (1e-3)\n* Loss: MSE Loss\n* LB: 246.349\n\nInference: Trained using Google Colab\n* Model: Single mode baseline (resnet18)\n* Steps: Trained for 30000 iterations (batch 16)\n* Size: Input size 350px, history 1s (10 frames)\n* Optimizer: Adam (1e-3)\n* Loss: MSE Loss\n* LB: 169.83\n\n## 5.1 <a name='5-1'>Test DataLoader</a>\n\n[Table of Contents](#0.1)","metadata":{}},{"cell_type":"code","source":"# test configuration\ntest_cfg = inference_cfg[\"test_data_loader\"]\n\n# Rasterizer\nrasterizer = build_rasterizer(inference_cfg, dm)\n\n# Test dataset/dataloader\ntest_zarr = ChunkedDataset(dm.require(test_cfg[\"key\"])).open()\ntest_mask = np.load(f\"{DIR_INPUT}/scenes/mask.npz\")[\"arr_0\"]\ntest_dataset = AgentDataset(inference_cfg, test_zarr, rasterizer, agents_mask=test_mask)\ntest_dataloader = DataLoader(test_dataset,\n                             shuffle=test_cfg[\"shuffle\"],\n                             batch_size=test_cfg[\"batch_size\"],\n                             num_workers=test_cfg[\"num_workers\"])\n\n\nprint(test_dataloader)","metadata":{"trusted":true,"execution":{"iopub.status.busy":"2025-05-31T02:08:06.211859Z","iopub.execute_input":"2025-05-31T02:08:06.212172Z","iopub.status.idle":"2025-05-31T02:08:33.821982Z","shell.execute_reply.started":"2025-05-31T02:08:06.212146Z","shell.execute_reply":"2025-05-31T02:08:33.821181Z"}},"outputs":[],"execution_count":null},{"cell_type":"markdown","source":"## 5.2 <a id='5-2'>Getting Predictions</a>\n\n[Table of Contents](#0.1)","metadata":{}},{"cell_type":"code","source":"# Saved state dict from the training notebook\nWEIGHT_FILE = '/kaggle/input/lyft-l5-weights/model_state_last.pth'\nmodel_state = torch.load(WEIGHT_FILE, map_location=device)\nmodel.load_state_dict(model_state)","metadata":{"trusted":true,"execution":{"iopub.status.busy":"2025-05-31T02:09:18.212361Z","iopub.execute_input":"2025-05-31T02:09:18.212695Z","iopub.status.idle":"2025-05-31T02:09:18.257534Z","shell.execute_reply.started":"2025-05-31T02:09:18.212665Z","shell.execute_reply":"2025-05-31T02:09:18.255819Z"}},"outputs":[],"execution_count":null},{"cell_type":"markdown","source":"**For loading checkpoint**\n\nWEIGHT_FILE = '/kaggle/input/lyft-l5-weights/resnet34_300x300_model_state_15000.pth'\n<br>\nmodel_state = torch.load(WEIGHT_FILE, map_location=device)\n<br>\nmodel.load_state_dict(model_state['model_state_dict'])","metadata":{}},{"cell_type":"code","source":"device","metadata":{"trusted":true,"execution":{"iopub.status.busy":"2025-05-31T01:11:52.411763Z","iopub.status.idle":"2025-05-31T01:11:52.412092Z","shell.execute_reply":"2025-05-31T01:11:52.411927Z"}},"outputs":[],"execution_count":null},{"cell_type":"markdown","source":"We need to run below two cell to make predictions and generate **submission.csv**. I am going to use my submission.csv here since I am getting memory error while making predictions. ","metadata":{}},{"cell_type":"code","source":"\nmodel.eval()\ntorch.set_grad_enabled(False)\n\n# store information for evaluation\nfuture_coords_offsets_pd = []\ntimestamps = []\n\nagent_ids = []\nprogress_bar = tqdm(test_dataloader)\nfor data in progress_bar:\n    \n    inputs = data[\"image\"].to(device)\n    target_availabilities = data[\"target_availabilities\"].unsqueeze(-1).to(device)\n    targets = data[\"target_positions\"].to(device)\n\n    outputs = model(inputs).reshape(targets.shape)\n    \n    future_coords_offsets_pd.append(outputs.cpu().numpy().copy())\n    timestamps.append(data[\"timestamp\"].numpy().copy())\n    agent_ids.append(data[\"track_id\"].numpy().copy())","metadata":{"trusted":true,"_kg_hide-output":true,"execution":{"iopub.status.busy":"2025-05-31T02:17:02.440764Z","iopub.execute_input":"2025-05-31T02:17:02.441058Z"}},"outputs":[],"execution_count":null},{"cell_type":"markdown","source":"## 5.3 <a id='5-3'>Submission</a>\n\n[Table of Contents](#0.1)","metadata":{}},{"cell_type":"code","source":"# submission.csv\n'''\nwrite_pred_csv('submission.csv',\n               timestamps=np.concatenate(timestamps),\n               track_ids=np.concatenate(agent_ids),\n               coords=np.concatenate(future_coords_offsets_pd),\n              )\n              \n'''\nmodel_sub = pd.read_csv('/kaggle/input/lyft-l5-inference-batch64-resnet18/submission.csv')\nmodel_sub.to_csv('submission.csv', index = False)","metadata":{"trusted":true,"execution":{"iopub.status.busy":"2025-05-31T01:11:52.414032Z","iopub.status.idle":"2025-05-31T01:11:52.414414Z","shell.execute_reply":"2025-05-31T01:11:52.414225Z"}},"outputs":[],"execution_count":null},{"cell_type":"markdown","source":"# 6. <a id='6'>References📎</a>\n\n[Table of Contents](#0.1)\n\n* https://www.twi-global.com/technical-knowledge/faqs/what-is-an-autonomous-vehicle\n* [Negative log-likelihood](https://github.com/lyft/l5kit/blob/master/competition.md)\n* https://www.kaggle.com/pestipeti/pytorch-baseline-train\n* https://self-driving.lyft.com/level5/prediction/\n* https://www.kaggle.com/corochann/lyft-deep-into-the-l5kit-library\n* https://www.kaggle.com/corochann/lyft-deep-into-the-l5kit-library#1.-Understanding-Rasterizer-class\n* https://www.kaggle.com/gpreda/lyft-first-data-exploration","metadata":{}}]}