
Congratulations to all the winners, and thanks so much for hosting such an interesting competition! I'll share our solution.
\n
Our dataset is based on indoor-unified-wifi-ds. The major differences are as follows.
\n
Our Model is based on LSTM by Keras with Unified Wi-Fi Feats. Since this LSTM model is not time series based, we also use the MLP model.
\nUsing features is following.
# timediff -> weight\ntimediff = df['timediff'].astype(np.float32).abs().values\nweight = 1- (timediff/np.max(timediff)) \n\nclass WeightedMSELoss(nn.Module):\n def __init__(self):\n super().__init__()\n self.loss = nn.MSELoss(reduction='none')\n\n def forward(self, input, target, weight):\n input = input.float()\n target = target.float()\n weight = torch.stack((weight, weight), 1).float() \n loss = self.loss(input, target) * weight \n return loss.mean()\nRe-learn by adding the following elements.
\nWe use three-pp which were shared in Notebook & Discussion.
\nWe repeated three-pp 6 times. It is very effective.
| \n | \n |
|---|---|
 | \n | \n
| sparse | \ndense | \nedge | \n
|---|---|---|
 | \n | \n | \n
We did stacking and extra grid ensemble. We did post processing with 4 different patterns. Then, did ensemble by weighted average.
\n4 pattern is here.
\n① snap to grid’s threshold=None / sparse extra grid
\n② snap to grid’s threshold=None / dense extra grid
\n③ snap to grid’s threshold=None / edge extra grid
\n④ snap to grid’s threshold=5 / only train grid
Thank you!
", "messages": [ { "id": "1312381", "postDate": "05/18/2021 02:53:18", "content": "Congratulations to all the winners, and thanks so much for hosting such an interesting competition! I'll share our solution.
\n
Our dataset is based on indoor-unified-wifi-ds. The major differences are as follows.
\nOur Model is based on LSTM by Keras with Unified Wi-Fi Feats. Since this LSTM model is not time series based, we also use the MLP model.
\nUsing features is following.
# timediff -> weight\ntimediff = df['timediff'].astype(np.float32).abs().values\nweight = 1- (timediff/np.max(timediff)) \n\nclass WeightedMSELoss(nn.Module):\n def __init__(self):\n super().__init__()\n self.loss = nn.MSELoss(reduction='none')\n\n def forward(self, input, target, weight):\n input = input.float()\n target = target.float()\n weight = torch.stack((weight, weight), 1).float() \n loss = self.loss(input, target) * weight \n return loss.mean()\nRe-learn by adding the following elements.
\nWe use three-pp which were shared in Notebook & Discussion.
\nWe repeated three-pp 6 times. It is very effective.
| \n | \n |
|---|---|
| \n | \n
| sparse | \ndense | \nedge | \n
|---|---|---|
| \n | \n | \n
We did stacking and extra grid ensemble. We did post processing with 4 different patterns. Then, did ensemble by weighted average.
\n4 pattern is here.
\n① snap to grid’s threshold=None / sparse extra grid
\n② snap to grid’s threshold=None / dense extra grid
\n③ snap to grid’s threshold=None / edge extra grid
\n④ snap to grid’s threshold=5 / only train grid
Thank you!
", "rawMarkdown": "Congratulations to all the winners, and thanks so much for hosting such an interesting competition! I'll share our solution. \n\n## Summary\n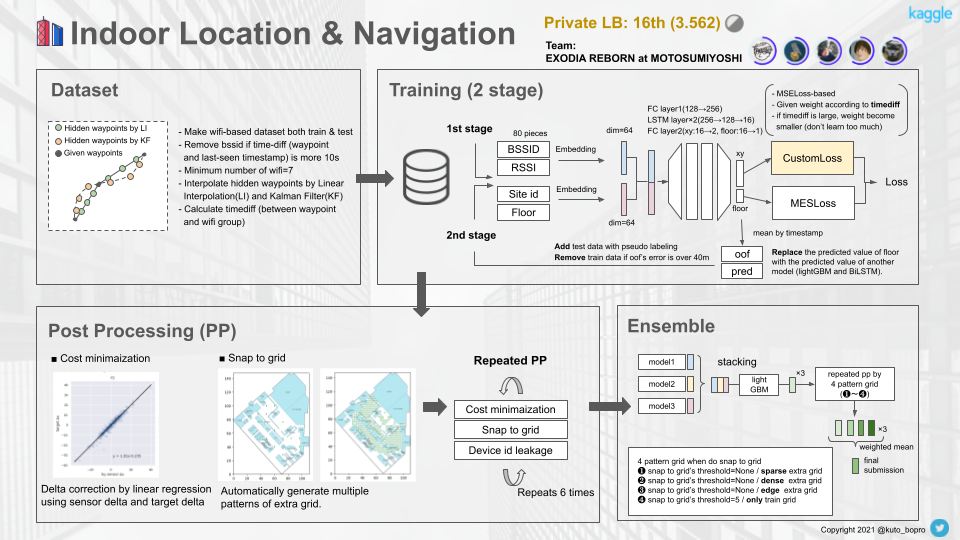\n\n\n---\n\n## dataset\nOur dataset is based on [indoor-unified-wifi-ds](https://www.kaggle.com/kokitanisaka/indoorunifiedwifids). The major differences are as follows.\n- Remove the data, if the difference between timestamp of waypoint and last seen timestamp of wifi is more than 10s. **(This is very important)**\n- The test data was also created as a wifi-based dataset in the same way as the train in order to average the timestamp during inference. So there are about three times as many lines as the original.\n- The hidden waypoints are complemented by [Linear Interpolation](https://www.kaggle.com/kuto0633/linear-interpolation-for-waypoint-in-wifi-dataset) and [Kalman Filter](https://www.kaggle.com/arnaudcapitaine/get-indoor-location-by-means-of-kalman-smoother). This can be expected to have a padding effect on the data.\n\n\n---\n## model\n### model for xy\nOur Model is based on [LSTM by Keras with Unified Wi-Fi Feats](https://www.kaggle.com/kokitanisaka/lstm-by-keras-with-unified-wi-fi-feats). Since this LSTM model is not time series based, we also use the MLP model. \nUsing features is following.\n- 80 pieces BSSID\n- 80 pieces RSSI\n- site id \n- floor (In inference, we use values which other model predict)\n\n### model for floor\n- lightGBM (also try BiLSTM)\n- Learning as a classification\n- Create model in each site\n- Create dataset each path file as one line\n- StratifiedGroupKFold\n- features\n - BSSID \n - Mean RSSI\n - Max RSSI\n - Extract BSSIDs that are present in both test and train.\n\n\n---\n## training (2stage) \n\n### 1st stage\n- Almost as shown in the figure above.\n- Custom loss\nEach data in our dataset has timediff(time difference between timestamp of waypoint and timestamp of wifi group). The larger this timediff is, the larger the discrepancy between the given target and the ground truth. So we apply Weighted-Loss according to timediff.\n\n```python\n# timediff -> weight\ntimediff = df['timediff'].astype(np.float32).abs().values\nweight = 1- (timediff/np.max(timediff)) \n\nclass WeightedMSELoss(nn.Module):\n def __init__(self):\n super().__init__()\n self.loss = nn.MSELoss(reduction='none')\n\n def forward(self, input, target, weight):\n input = input.float()\n target = target.float()\n weight = torch.stack((weight, weight), 1).float() \n loss = self.loss(input, target) * weight \n return loss.mean()\n```\n\n### 2nd stage\nRe-learn by adding the following elements.\n- Add test data by pseudo labelig \n- Remove train data if oof's error is over 40m (also try to remove over 20m)\n\n---\n## post processing (pp)\n\nWe use three-pp which were shared in Notebook & Discussion.\nWe repeated three-pp **6 times**. It is very effective.\n\n- [Cost minimaization](https://www.kaggle.com/saitodevel01/indoor-post-processing-by-cost-minimization)\nThere are difference between delta by sensor and delta by target. So we corrected sensor delta by the coefficients which obtained by linear regression in each site and each floor.\n\n| | |\n| --- | --- |\n| | |\n \n \n- [Snap to grid](https://www.kaggle.com/robikscube/indoor-navigation-snap-to-grid-post-processing)\nWe automatically generated 3 pattern extra grids instead of hand-labeling grids like following. \n \n| sparse | dense | edge |\n| --- | --- | --- |\n| | | \n \n \n- [device id leak](https://www.kaggle.com/iwatatakuya/use-leakage-considering-device-id-postprocess)\n\n## ensemble\nWe did stacking and extra grid ensemble. We did post processing with 4 different patterns. Then, did ensemble by weighted average.\n\n4 pattern is here.\n① snap to grid’s threshold=None / sparse extra grid\n② snap to grid’s threshold=None / dense extra grid\n③ snap to grid’s threshold=None / edge extra grid\n④ snap to grid’s threshold=5 / only train grid\n\n---\n\nThank you!",
"votes": null
},
{
"id": "1312429",
"postDate": "05/18/2021 03:52:10",
"content": "Thank you for publishing a great solution.Can you tell me about the post-processing repeat?
\nI have tried repeats and found them to be effective in some cases and vice versa. I wasn't confident about the effectiveness of repeat so I didn't use it in my final sub.
\nWhat was your score before post-processing?
\n Also, how effective were the repeats without extra grids?
Personally, I think that if there are no extra grid points, there will be no effect of repeating the process.
", "rawMarkdown": "Thank you for publishing a great solution.Can you tell me about the post-processing repeat?\n\nI have tried repeats and found them to be effective in some cases and vice versa. I wasn't confident about the effectiveness of repeat so I didn't use it in my final sub.\n\nWhat was your score before post-processing?\n Also, how effective were the repeats without extra grids?\n\nPersonally, I think that if there are no extra grid points, there will be no effect of repeating the process.", "votes": null }, { "id": "1312465", "postDate": "05/18/2021 04:41:31", "content": "@dehokanta Thanks for your comment.
\n\n\nWhat was your score before post-processing?
\n
\n Also, how effective were the repeats without extra grids?
Our single model's CV is here.
\nThis score is used extra grid, but the one which is not used extra grid is almost same improvement.
\nAfter the 3 times, the effect of pp slowed down but the CV increased, so we decided 6 times.
| \n | CV score | \n
|---|---|
| CV(not pp) | \n6.311 | \n
| CV(pp×1) | \n4.672 | \n
| CV(pp×2) | \n4.377 | \n
\n\nPersonally, I think that if there are no extra grid points, there will be no effect of repeating the process.
\n
There are also good effect by repeating without extra-grids in our case. By doing snap to grid(N-1 times.), the predicted waypoints closer to ground truth, so the result of Cost Minimaization(N times) also changed, and the score improved, I think.
", "rawMarkdown": "dehokanta Thanks for your comment.\n\n> What was your score before post-processing?\nAlso, how effective were the repeats without extra grids?\n\nOur single model's CV is here. \nThis score is used extra grid, but the one which is not used extra grid is almost same improvement.\nAfter the 3 times, the effect of pp slowed down but the CV increased, so we decided 6 times.\n\n| | CV score | \n| --- | --- | \n| CV(not pp) | 6.311 |\n| CV(pp×1) | 4.672 | \n| CV(pp×2) | 4.377 | \n\n> Personally, I think that if there are no extra grid points, there will be no effect of repeating the process.\n\nThere are also good effect by repeating without extra-grids in our case. By doing snap to grid(N-1 times.), the predicted waypoints closer to ground truth, so the result of Cost Minimaization(N times) also changed, and the score improved, I think.", "votes": null }, { "id": "1312549", "postDate": "05/18/2021 05:37:52", "content": "@kuto0633 Thanks for the quick reply.
\nThe result of our PP (without hand label) loop was this.
| \n | Public Score | \n
|---|---|
| without PP | \n5.096 | \n
| PP×1 | \n3.569 | \n
| PP×4 | \n3.766 | \n
I didn't use any additional grids, so Snap to Grid moved from the correct position to the wrong position, which may be why our score didn't improve.
\nThank you very much for valuable comments.
", "rawMarkdown": "kuto0633 Thanks for the quick reply.\nThe result of our PP (without hand label) loop was this.\n| | Public Score |\n| --- | --- |\n| without PP | 5.096 |\n| PP×1 | 3.569 |\n| PP×4 | 3.766 |\n\nI didn't use any additional grids, so Snap to Grid moved from the correct position to the wrong position, which may be why our score didn't improve.\n\nThank you very much for valuable comments.", "votes": null }, { "id": "1313046", "postDate": "05/18/2021 11:37:04", "content": "Thank you for sharing this great solution!
\nI learned a lot from this 😃 (eg. Custom loss, Removing big timediff samples or large loss samples, pseudo labeling)
I have one question about your model.
\n\n\nSince this LSTM model is not time series based, we also use the MLP model.
\n
Does this mean you created two different models (not time-series lstm and mlp) and the latter MLP model used time-series information like gru or lstm ?
\nThanks in advance!
", "rawMarkdown": "Thank you for sharing this great solution!\nI learned a lot from this 😃 (eg. Custom loss, Removing big timediff samples or large loss samples, pseudo labeling)\n\nI have one question about your model.\n> Since this LSTM model is not time series based, we also use the MLP model.\n\nDoes this mean you created two different models (not time-series lstm and mlp) and the latter MLP model used time-series information like gru or lstm ?\n\nThanks in advance!", "votes": null }, { "id": "1313076", "postDate": "05/18/2021 11:52:40", "content": "@yutoshibata Thanks! I'm glad such your comments.
\n\n\nyou created two different models (not time-series lstm and mlp)
\n
Yes, I and another teammate created LSTM, and the other created MLP.
\n\n\nthe latter MLP model used time-series information like gru or lstm ?
\n
No, I mean that our LSTM is almost the same as MLP because it doesn't deal with time series. So our any model are not time-series.
", "rawMarkdown": "yutoshibata Thanks! I'm glad such your comments.\n> you created two different models (not time-series lstm and mlp) \n\nYes, I and another teammate created LSTM, and the other created MLP.\n\n> the latter MLP model used time-series information like gru or lstm ?\n\nNo, I mean that our LSTM is almost the same as MLP because it doesn't deal with time series. So our any model are not time-series.", "votes": null }, { "id": "1313315", "postDate": "05/18/2021 14:03:36", "content": "@kuto0633 Thanks ! I totally understand your comment 😃
\nI used MLP too but CV score was 7.3….
\nI think removing some samples or using KF or custom loss made this big difference.
\nAnyway, thank you for explaining your solution kindly🙌
Thank you for sharing!
\nI had a lot to learn from your great solutions.
\n\nRemove the data, if the difference between timestamp of waypoint and last seen timestamp of wifi is more than 10s. (This is very important)
\n
Actually, I was able to improve my score significantly by adopting this idea as well.
\nHowever, my approach to discarding data is a little different from yours. I did not give any superiority to the importance based on the time difference from the waypoint, so I focused on the relation between last seen timestamp and wifi timestamp at the same row in the text file. For example,
timestamp=1000, bssid=AAA, lastseen_ts=950 <-- keep
\ntimestamp=1200, bssid=AAA, lastseen_ts=950 <-- discard because this information is older than the previous row
Now that I know how to skillfully utilize the time difference from the waypoint, I feel that your method is better.
\nI would be happy to hear your frank opinion.
@horsek Thanks and congrats your silver medal!
\nI understand your approach. Maybe it almost same effect as ours if you set the appropriate timediff-threshold(=10s in our case).
t_l: wifi last seen timestamp\nt_g: wifi group timestamp\nt_w: waypoint timestamp\n\nour timediff\n = t_w - t_l\n\nyour timediff\n= t_g - t_l \n= (t_g - t_l) + (t_w - t_w) \n= (t_w - t_l) + (t_g - t_w) \n= (our timediff) + (t_g - t_w)\nwhere (t_g - t_w) should be constant if we and you use kouki's dataset.
\nIf there are any mistakes, please point them out.
", "rawMarkdown": "horsek Thanks and congrats your silver medal!\nI understand your approach. Maybe it almost same effect as ours if you set the appropriate timediff-threshold(=10s in our case).\n\n```\nt_l: wifi last seen timestamp\nt_g: wifi group timestamp\nt_w: waypoint timestamp\n\nour timediff\n = t_w - t_l\n\nyour timediff\n= t_g - t_l \n= (t_g - t_l) + (t_w - t_w) \n= (t_w - t_l) + (t_g - t_w) \n= (our timediff) + (t_g - t_w)\n\n```\nwhere (t_g - t_w) should be constant if we and you use kouki's dataset.\n\nIf there are any mistakes, please point them out.", "votes": null }, { "id": "1313720", "postDate": "05/18/2021 17:14:59", "content": "Thank you! Congrats to you too on your silver medal.
\nI see. I agree that we are essentially doing the same thing. And the fact that both of our models have shown pretty good improvement tells that you are right.
Thanks for Sharing this to us.
\nUpvote for you.
Thank you for publishing a great solution.Can you tell me about the post-processing repeat?
\nI have tried repeats and found them to be effective in some cases and vice versa. I wasn't confident about the effectiveness of repeat so I didn't use it in my final sub.
\nWhat was your score before post-processing?
\n Also, how effective were the repeats without extra grids?
Personally, I think that if there are no extra grid points, there will be no effect of repeating the process.
", "votes": null, "replies": [ { "id": 1312465, "author_name": "kuto0633", "author_url": "", "post_date": "05/18/2021 04:41:31", "content": "@dehokanta Thanks for your comment.
\n\n\nWhat was your score before post-processing?
\n
\n Also, how effective were the repeats without extra grids?
Our single model's CV is here.
\nThis score is used extra grid, but the one which is not used extra grid is almost same improvement.
\nAfter the 3 times, the effect of pp slowed down but the CV increased, so we decided 6 times.
| \n | CV score | \n
|---|---|
| CV(not pp) | \n6.311 | \n
| CV(pp×1) | \n4.672 | \n
| CV(pp×2) | \n4.377 | \n
\n\nPersonally, I think that if there are no extra grid points, there will be no effect of repeating the process.
\n
There are also good effect by repeating without extra-grids in our case. By doing snap to grid(N-1 times.), the predicted waypoints closer to ground truth, so the result of Cost Minimaization(N times) also changed, and the score improved, I think.
", "votes": null, "replies": [] }, { "id": 1312549, "author_name": "dehokanta", "author_url": "", "post_date": "05/18/2021 05:37:52", "content": "@kuto0633 Thanks for the quick reply.
\nThe result of our PP (without hand label) loop was this.
| \n | Public Score | \n
|---|---|
| without PP | \n5.096 | \n
| PP×1 | \n3.569 | \n
| PP×4 | \n3.766 | \n
I didn't use any additional grids, so Snap to Grid moved from the correct position to the wrong position, which may be why our score didn't improve.
\nThank you very much for valuable comments.
", "votes": null, "replies": [] } ] }, { "id": 1313046, "author_name": "yutoshibata", "author_url": "", "post_date": "05/18/2021 11:37:04", "content": "Thank you for sharing this great solution!
\nI learned a lot from this 😃 (eg. Custom loss, Removing big timediff samples or large loss samples, pseudo labeling)
I have one question about your model.
\n\n\nSince this LSTM model is not time series based, we also use the MLP model.
\n
Does this mean you created two different models (not time-series lstm and mlp) and the latter MLP model used time-series information like gru or lstm ?
\nThanks in advance!
", "votes": null, "replies": [ { "id": 1313076, "author_name": "kuto0633", "author_url": "", "post_date": "05/18/2021 11:52:40", "content": "@yutoshibata Thanks! I'm glad such your comments.
\n\n\nyou created two different models (not time-series lstm and mlp)
\n
Yes, I and another teammate created LSTM, and the other created MLP.
\n\n\nthe latter MLP model used time-series information like gru or lstm ?
\n
No, I mean that our LSTM is almost the same as MLP because it doesn't deal with time series. So our any model are not time-series.
", "votes": null, "replies": [] }, { "id": 1313315, "author_name": "yutoshibata", "author_url": "", "post_date": "05/18/2021 14:03:36", "content": "@kuto0633 Thanks ! I totally understand your comment 😃
\nI used MLP too but CV score was 7.3….
\nI think removing some samples or using KF or custom loss made this big difference.
\nAnyway, thank you for explaining your solution kindly🙌
Thank you for sharing!
\nI had a lot to learn from your great solutions.
\n\nRemove the data, if the difference between timestamp of waypoint and last seen timestamp of wifi is more than 10s. (This is very important)
\n
Actually, I was able to improve my score significantly by adopting this idea as well.
\nHowever, my approach to discarding data is a little different from yours. I did not give any superiority to the importance based on the time difference from the waypoint, so I focused on the relation between last seen timestamp and wifi timestamp at the same row in the text file. For example,
timestamp=1000, bssid=AAA, lastseen_ts=950 <-- keep
\ntimestamp=1200, bssid=AAA, lastseen_ts=950 <-- discard because this information is older than the previous row
Now that I know how to skillfully utilize the time difference from the waypoint, I feel that your method is better.
\nI would be happy to hear your frank opinion.
@horsek Thanks and congrats your silver medal!
\nI understand your approach. Maybe it almost same effect as ours if you set the appropriate timediff-threshold(=10s in our case).
t_l: wifi last seen timestamp\nt_g: wifi group timestamp\nt_w: waypoint timestamp\n\nour timediff\n = t_w - t_l\n\nyour timediff\n= t_g - t_l \n= (t_g - t_l) + (t_w - t_w) \n= (t_w - t_l) + (t_g - t_w) \n= (our timediff) + (t_g - t_w)\nwhere (t_g - t_w) should be constant if we and you use kouki's dataset.
\nIf there are any mistakes, please point them out.
", "votes": null, "replies": [] }, { "id": 1313720, "author_name": "horsek", "author_url": "", "post_date": "05/18/2021 17:14:59", "content": "Thank you! Congrats to you too on your silver medal.
\nI see. I agree that we are essentially doing the same thing. And the fact that both of our models have shown pretty good improvement tells that you are right.
Thanks for Sharing this to us.
\nUpvote for you.
\n\n---\n## model\n### model for xy\nOur Model is based on [LSTM by Keras with Unified Wi-Fi Feats](https://www.kaggle.com/kokitanisaka/lstm-by-keras-with-unified-wi-fi-feats). Since this LSTM model is not time series based, we also use the MLP model. \nUsing features is following.\n- 80 pieces BSSID\n- 80 pieces RSSI\n- site id \n- floor (In inference, we use values which other model predict)\n\n### model for floor\n- lightGBM (also try BiLSTM)\n- Learning as a classification\n- Create model in each site\n- Create dataset each path file as one line\n- StratifiedGroupKFold\n- features\n - BSSID \n - Mean RSSI\n - Max RSSI\n - Extract BSSIDs that are present in both test and train.\n\n\n---\n## training (2stage) \n\n### 1st stage\n- Almost as shown in the figure above.\n- Custom loss\nEach data in our dataset has timediff(time difference between timestamp of waypoint and timestamp of wifi group). The larger this timediff is, the larger the discrepancy between the given target and the ground truth. So we apply Weighted-Loss according to timediff.\n\n```python\n# timediff -> weight\ntimediff = df['timediff'].astype(np.float32).abs().values\nweight = 1- (timediff/np.max(timediff)) \n\nclass WeightedMSELoss(nn.Module):\n def __init__(self):\n super().__init__()\n self.loss = nn.MSELoss(reduction='none')\n\n def forward(self, input, target, weight):\n input = input.float()\n target = target.float()\n weight = torch.stack((weight, weight), 1).float() \n loss = self.loss(input, target) * weight \n return loss.mean()\n```\n\n### 2nd stage\nRe-learn by adding the following elements.\n- Add test data by pseudo labelig \n- Remove train data if oof's error is over 40m (also try to remove over 20m)\n\n---\n## post processing (pp)\n\nWe use three-pp which were shared in Notebook & Discussion.\nWe repeated three-pp **6 times**. It is very effective.\n\n- [Cost minimaization](https://www.kaggle.com/saitodevel01/indoor-post-processing-by-cost-minimization)\nThere are difference between delta by sensor and delta by target. So we corrected sensor delta by the coefficients which obtained by linear regression in each site and each floor.\n\n| | |\n| --- | --- |\n| | |\n \n \n- [Snap to grid](https://www.kaggle.com/robikscube/indoor-navigation-snap-to-grid-post-processing)\nWe automatically generated 3 pattern extra grids instead of hand-labeling grids like following. \n \n| sparse | dense | edge |\n| --- | --- | --- |\n| | | \n \n \n- [device id leak](https://www.kaggle.com/iwatatakuya/use-leakage-considering-device-id-postprocess)\n\n## ensemble\nWe did stacking and extra grid ensemble. We did post processing with 4 different patterns. Then, did ensemble by weighted average.\n\n4 pattern is here.\n① snap to grid’s threshold=None / sparse extra grid\n② snap to grid’s threshold=None / dense extra grid\n③ snap to grid’s threshold=None / edge extra grid\n④ snap to grid’s threshold=5 / only train grid\n\n---\n\nThank you!",
"1312429": "Thank you for publishing a great solution.Can you tell me about the post-processing repeat?\n\nI have tried repeats and found them to be effective in some cases and vice versa. I wasn't confident about the effectiveness of repeat so I didn't use it in my final sub.\n\nWhat was your score before post-processing?\n Also, how effective were the repeats without extra grids?\n\nPersonally, I think that if there are no extra grid points, there will be no effect of repeating the process.",
"1312465": "dehokanta Thanks for your comment.\n\n> What was your score before post-processing?\nAlso, how effective were the repeats without extra grids?\n\nOur single model's CV is here. \nThis score is used extra grid, but the one which is not used extra grid is almost same improvement.\nAfter the 3 times, the effect of pp slowed down but the CV increased, so we decided 6 times.\n\n| | CV score | \n| --- | --- | \n| CV(not pp) | 6.311 |\n| CV(pp×1) | 4.672 | \n| CV(pp×2) | 4.377 | \n\n> Personally, I think that if there are no extra grid points, there will be no effect of repeating the process.\n\nThere are also good effect by repeating without extra-grids in our case. By doing snap to grid(N-1 times.), the predicted waypoints closer to ground truth, so the result of Cost Minimaization(N times) also changed, and the score improved, I think.",
"1312549": "kuto0633 Thanks for the quick reply.\nThe result of our PP (without hand label) loop was this.\n| | Public Score |\n| --- | --- |\n| without PP | 5.096 |\n| PP×1 | 3.569 |\n| PP×4 | 3.766 |\n\nI didn't use any additional grids, so Snap to Grid moved from the correct position to the wrong position, which may be why our score didn't improve.\n\nThank you very much for valuable comments.",
"1313046": "Thank you for sharing this great solution!\nI learned a lot from this 😃 (eg. Custom loss, Removing big timediff samples or large loss samples, pseudo labeling)\n\nI have one question about your model.\n> Since this LSTM model is not time series based, we also use the MLP model.\n\nDoes this mean you created two different models (not time-series lstm and mlp) and the latter MLP model used time-series information like gru or lstm ?\n\nThanks in advance!",
"1313076": "yutoshibata Thanks! I'm glad such your comments.\n> you created two different models (not time-series lstm and mlp) \n\nYes, I and another teammate created LSTM, and the other created MLP.\n\n> the latter MLP model used time-series information like gru or lstm ?\n\nNo, I mean that our LSTM is almost the same as MLP because it doesn't deal with time series. So our any model are not time-series.",
"1313315": "kuto0633 Thanks ! I totally understand your comment 😃\nI used MLP too but CV score was 7.3....\nI think removing some samples or using KF or custom loss made this big difference.\nAnyway, thank you for explaining your solution kindly🙌",
"1313406": "Thank you for sharing!\nI had a lot to learn from your great solutions.\n> Remove the data, if the difference between timestamp of waypoint and last seen timestamp of wifi is more than 10s. (This is very important) \n\nActually, I was able to improve my score significantly by adopting this idea as well.\nHowever, my approach to discarding data is a little different from yours. I did not give any superiority to the importance based on the time difference from the waypoint, so I focused on the relation between last seen timestamp and wifi timestamp at the same row in the text file. For example, \n \ntimestamp=1000, bssid=AAA, lastseen_ts=950 <-- keep\ntimestamp=1200, bssid=AAA, lastseen_ts=950 <-- discard because this information is older than the previous row\n \nNow that I know how to skillfully utilize the time difference from the waypoint, I feel that your method is better.\nI would be happy to hear your frank opinion.",
"1313548": "horsek Thanks and congrats your silver medal!\nI understand your approach. Maybe it almost same effect as ours if you set the appropriate timediff-threshold(=10s in our case).\n\n```\nt_l: wifi last seen timestamp\nt_g: wifi group timestamp\nt_w: waypoint timestamp\n\nour timediff\n = t_w - t_l\n\nyour timediff\n= t_g - t_l \n= (t_g - t_l) + (t_w - t_w) \n= (t_w - t_l) + (t_g - t_w) \n= (our timediff) + (t_g - t_w)\n\n```\nwhere (t_g - t_w) should be constant if we and you use kouki's dataset.\n\nIf there are any mistakes, please point them out.",
"1313720": "Thank you! Congrats to you too on your silver medal.\nI see. I agree that we are essentially doing the same thing. And the fact that both of our models have shown pretty good improvement tells that you are right.",
"1323375": "Thanks for Sharing this to us. \nUpvote for you."
},
"source": "meta"
}