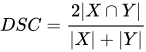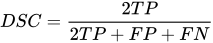
{"metadata":{"kernelspec":{"language":"python","display_name":"Python 3","name":"python3"},"language_info":{"pygments_lexer":"ipython3","nbconvert_exporter":"python","version":"3.6.4","file_extension":".py","codemirror_mode":{"name":"ipython","version":3},"name":"python","mimetype":"text/x-python"}},"nbformat_minor":4,"nbformat":4,"cells":[{"cell_type":"code","source":"# This Python 3 environment comes with many helpful analytics libraries installed\n# It is defined by the kaggle/python Docker image: https://github.com/kaggle/docker-python\n# For example, here's several helpful packages to load\n\nimport numpy as np # linear algebra\nimport pandas as pd # data processing, CSV file I/O (e.g. pd.read_csv)\n\n# Input data files are available in the read-only \"../input/\" directory\n# For example, running this (by clicking run or pressing Shift+Enter) will list all files under the input directory\n\nimport os\nfor dirname, _, filenames in os.walk('/kaggle/input'):\n    for filename in filenames:\n        print(os.path.join(dirname, filename))\n\n# You can write up to 20GB to the current directory (/kaggle/working/) that gets preserved as output when you create a version using \"Save & Run All\" \n# You can also write temporary files to /kaggle/temp/, but they won't be saved outside of the current session","metadata":{"_uuid":"8f2839f25d086af736a60e9eeb907d3b93b6e0e5","_cell_guid":"b1076dfc-b9ad-4769-8c92-a6c4dae69d19","execution":{"iopub.status.busy":"2022-06-25T03:31:59.689184Z","iopub.execute_input":"2022-06-25T03:31:59.690234Z","iopub.status.idle":"2022-06-25T03:31:59.803084Z","shell.execute_reply.started":"2022-06-25T03:31:59.690122Z","shell.execute_reply":"2022-06-25T03:31:59.801777Z"},"_kg_hide-output":true,"collapsed":true,"jupyter":{"outputs_hidden":true},"trusted":true},"execution_count":null,"outputs":[]},{"cell_type":"markdown","source":"<h1 style=\"font-family:verdana;\"> <center>HuBMAP + HPA - Hacking the Human Body</center> </h1>\n<p><center style=\"color:#159364; font-family:cursive;\">Segment multi-organ functional tissue units</center></p>\n\n***\n\n<center><img src='https://hubmapconsortium.org/wp-content/uploads/2019/01/HuBMAP-Retina-Logo-Color.png'></img></center>","metadata":{}},{"cell_type":"markdown","source":"<p style=\"font-size:15px; font-family:verdana; line-height: 1.7em\">This is a competition in which we have to identify and segment functional tissue units (FTUs) across five human organs. We've to build our model using a dataset of tissue section images, with the best submissions segmenting FTUs as accurately as possible.<br/><br/>\nThis competition is evaluated on the mean Dice coefficient. This notebook tries to explain the <b>Dice Coefficient</b> and how it differs from another Image Segmentation score <b>Intersection-Over-Union</b>.</p>\n\n","metadata":{}},{"cell_type":"markdown","source":"<div style=\"background-color:green; border-radius:4px\">\n    <h2 style=\"padding:10px; color:white; font-family:cursive\">\n       1 | Dice Coefficient: A little background\n        <a class=\"anchor-link\" href=\"https://www.kaggle.com/arnavr10880/all-about-dice-coefficient/edit\">¶</a>\n    </h2>\n</div>","metadata":{}},{"cell_type":"markdown","source":"<p style=\"font-size:15px; font-family:verdana; line-height: 1.7em\">\n    Dice Coefficient or Dice similarity coefficient (DSC) is also known by the name <b>Sørensen–Dice index. It is a statistical tool which measures the similarity between two sets of data.\n</p>\n<h3 font-family:verdana; line-height: 1.7em>Why it is called as such?</h3>\n\n<p style=\"font-size:15px; font-family:verdana; line-height: 1.7em\">\nIt was independently developed by the **botanists**:\n<ul>\n    <li><b>Thorvald Sørensen</b>; and</li>\n    <li><b>Lee Raymond Dice</b></li><br>\n</p>\n<p style=\"font-size:15px; font-family:verdana; line-height: 1.7em\">\n    Hence, came the name <b>Dice Coefficient</b> or <b>Sørensen–Dice index</b>.\n</p>\n\n","metadata":{}},{"cell_type":"markdown","source":"<div style=\"background-color:green; border-radius:4px\">\n    <h2 style=\"padding:10px; color:white; font-family:cursive\"> 2 | Formula \n    <a class=\"anchor-link\" href=\"https://www.kaggle.com/arnavr10880/all-about-dice-coefficient/edit\">¶</a>\n    </h2>\n</div>","metadata":{}},{"cell_type":"markdown","source":"<p style=\"font-size:15px; font-family:verdana; line-height: 1.7em\">\n    The equation or formula for the Dice Coefficient is given as:\n</p>\n\n<center><img src='https://wikimedia.org/api/rest_v1/media/math/render/svg/a80a97215e1afc0b222e604af1b2099dc9363d3b'></img></center>\n\n<p style=\"font-size:15px; font-family:verdana; line-height: 1.7em\">\n    where:\n</p><br/>\n\n<h3 style=\"font-family:verdana; line-height: 1.7em\">In Mathematical Terms</h3>\n<p style=\"font-size:15px; font-family:verdana; line-height: 1.7em\">\n    <ul>\n        <li><b>|X|</b> and <b>|Y|</b> are two sets; </li>\n        <li><b>|   |</b> (vertical bars) refers to the cardinality i.e. the no of elements in that set. </li>\n        <li><b>∩</b> means the intersection of two sets i.e. elements common to both the sets.</li>\n    </ul>\n</p>\n\n<h3 style=\"font-family:verdana; line-height: 1.7em\">In Image Segmentation Terms (like in this competition)</h3>\n<p style=\"font-size:15px; font-family:verdana; line-height: 1.7em\">\n    <ul>\n        <li><b>X</b> is the predicted set of pixels; and </li>\n        <li><b>Y</b> is the ground truth.</li>\n    </ul>\n</p>\n\n<div class=\"alert alert-block alert-info\" style=\"font-family:verdana; line-height: 1.7em\"> 📌 Remember that in this competition, the leaderboard score is the <b>mean</b> of the Dice coefficients for each image in the test set.</div>\n\n<p style=\"font-size:15px; font-family:verdana; line-height: 1.7em\">\n    Also, when the same thing is applied to Boolean data, the <b>Dice Coefficient</b> can be written as:\n</p>\n\n\n\n<center><img src='https://wikimedia.org/api/rest_v1/media/math/render/svg/174f40f295f784c6fc6f78d359503821b757a353'></img></center>\n\n<p style=\"font-size:15px; font-family:verdana; line-height: 1.7em\">\n    where:\n</p><br/>\n<p style=\"font-size:15px; font-family:verdana; line-height: 1.7em\">\n    <ul>\n        <li><b>TP</b> is True Positives;</li>\n        <li><b>FP</b> is False Positives; and </li>\n        <li><b>FN</b> is False Negatives.</li>\n    </ul>\n</p>","metadata":{}},{"cell_type":"markdown","source":"<div style=\"background-color:green; border-radius:4px\">\n    <h2 style=\"padding:10px; color:white; font-family:cursive\"> 3 | Theory & difference from IoU\n    <a class=\"anchor-link\" href=\"https://www.kaggle.com/arnavr10880/all-about-dice-coefficient/edit\">¶</a>\n    </h2>\n</div>","metadata":{}},{"cell_type":"markdown","source":"<p style=\"font-size:15px; font-family:verdana; line-height: 1.7em\">\n    We can create our Segmentation model and train it, but to know about its accuracy, we need some kind of metric.<br/>\n    There are many but the essential metrics that we see often are:\n</p>\n\n<p style=\"font-size:15px; font-family:verdana; line-height: 1.7em\">\n    <ul>\n        <li><b>IOU (Intersection-Over-Union, Jaccard Index)</b></li>\n        <li><b>Dice Coefficient (F1-score)</b></li>\n    </ul>\n</p>","metadata":{}},{"cell_type":"markdown","source":"<p style=\"font-size:15px; font-family:verdana; line-height: 1.7em\">\n    Now, look at the below diagram.\n</p>\n\n\n<center><img src='https://miro.medium.com/max/858/1*yUd5ckecHjWZf6hGrdlwzA.png'></img></center>\n\n\n<p style=\"font-size:15px; font-family:verdana; line-height: 1.7em\">\n    The Dice Coefficient is simply the <b> 2 * the area of the overlap divided by the no. of pixels in both the images.</b><br/><br/>\n       Now, we may think wasn't that the same as <b>Intersection-Over-Union</b> as it follows the same structure:\n</p>\n\n\n<center><img src='https://www.researchgate.net/profile/Rafael-Padilla/publication/343194514/figure/fig2/AS:916944999956482@1595628132920/Intersection-Over-Union-IOU.ppm'></img></center>\n\n<p style=\"font-size:15px; font-family:verdana; line-height: 1.7em\">\n    Also, if we look at their boolean implementation formula:\n</p>\n\n- **Dice Coefficient**\n\n![equation](https://latex.codecogs.com/svg.image?%5Cfrac%7B2TP%7D%7B2TP%20&plus;%20FP%20&plus;%20FN%7D)\n\n- **IoU**\n\n![equation](https://latex.codecogs.com/svg.image?%5Cfrac%7BTP%7D%7BTP%20&plus;%20FP%20&plus;%20FN%7D%20)\n\n<p style=\"font-size:15px; font-family:verdana; line-height: 1.7em\">\n    The ratio between them can be related explicitly to the IoU like:\n</p>\n\n\n![equation](https://latex.codecogs.com/svg.image?Dice%20=%20%5Cfrac%7B2%20%5Ccdot%20IoU%7D%7BIoU%20&plus;%201%7D%20)","metadata":{}},{"cell_type":"markdown","source":"<h3 style=\"font-family:verdana; line-height: 1.7em; font-weight:600\">\n    So, where's the difference?\n</h3>\n\n<p style=\"font-size:15px; font-family:verdana; line-height: 1.7em\">\n    They <b>may</b> be same in the normal usage but the problem comes when taking the <b>average</b> or <b>mean score</b> over a set of inferences.\n</p>\n\n\n<p style=\"font-size:15px; font-family:verdana; line-height: 1.7em\">\n    Generally:\n</p>\n\n#### IoU\n\n<p style=\"font-size:15px; font-family:verdana; line-height: 1.7em\">\n    <ul>\n        <li style=\"font-size:15px; font-family:verdana; line-height: 1.7em\">tends to penalize single instances of bad classification more than the Dice Coefficient quantitatively even when they can both agree that this one instance is bad;</li>\n        <li style=\"font-size:15px; font-family:verdana; line-height: 1.7em\">is similar to how <b>L2</b> can penalize largest mistake than <b>L1</b>; and</li>\n        <li style=\"font-size:15px; font-family:verdana; line-height: 1.7em\">tends to have a <b>squaring</b> effect on the errors relative to Dice Score.</li>\n    </ul>\n</p>\n\n<div style=\"color:white;\n           display:fill;\n           border-radius:5px;\n           background-color:#5642C5;\n           font-size:110%;\n           font-family:Verdana;\n           letter-spacing:0.5px\">\n\n<p style=\"padding: 10px; color:white;\">\nHence, Dice Coefficient tends to measure something closer to average performance while the IoU score measures something closer to the worst case performance.\n</p>\n</div>","metadata":{}},{"cell_type":"markdown","source":"<div class=\"alert alert-block alert-info\"  style=\"font-size:15px; font-family:verdana; line-height: 1.7em\"> 📌 Hence the reason, the competition calculates the <b>mean</b> of the Dice Coefficient.</div>","metadata":{}},{"cell_type":"markdown","source":"<div style=\"background-color:green; border-radius:4px\">\n    <h2 style=\"padding:10px; color:white; font-family:cursive\"> 4 | Conclusions\n    <a class=\"anchor-link\" href=\"https://www.kaggle.com/arnavr10880/all-about-dice-coefficient/edit\">¶</a>\n    </h2>\n</div>","metadata":{}},{"cell_type":"markdown","source":"<p style=\"font-size:15px; font-family:verdana; line-height: 1.7em\">\n    In conclusion, the most commonly used metrics for semantic segmentation are the IoU and the Dice Coefficient.\n    In keras, to calculate the Dice Coefficient, we can do the following:\n</p>\n\n```python\nfrom keras import backend as K\n\ndef dice_coeff(y_true, y_pred, smooth=1):\n    y_true_flatten = K.flatten(y_true)\n    y_pred_flatten = K.flatten(y_pred)\n    intersection = K.sum(y_true_flatten * y_pred_flatten)\n    dice = (2. * intersection + smooth) / (K.sum(y_true_flatten) + K.sum(y_pred_flatten) + smooth)\n    return dice\n```\n","metadata":{}},{"cell_type":"markdown","source":"<div style=\"background-color:green; border-radius:4px\">\n    <h2 style=\"padding:10px; color:white; font-family:cursive\"> 5 | For extra reading\n    <a class=\"anchor-link\" href=\"https://www.kaggle.com/arnavr10880/all-about-dice-coefficient/edit\">¶</a>\n    </h2>\n</div>\n\n- <a href='https://stats.stackexchange.com/questions/195006/is-the-dice-coefficient-the-same-as-accuracy#:~:text=The%20Dice%20coefficient%20(also%20known%20as%20the%20S%C3%B8rensen%E2%80%93Dice%20coefficient,Negatives)%20Dice%20score%20is%20a'>Is the dice score same as accuracy?</a>\n- <a href='https://en.wikipedia.org/wiki/S%C3%B8rensen%E2%80%93Dice_coefficient'>Sorensen-Dice Coefficient</a>\n- <a href='https://www.jeremyjordan.me/evaluating-image-segmentation-models/'>https://www.jeremyjordan.me/evaluating-image-segmentation-models/</a>\n- <a href='https://neptune.ai/blog/image-segmentation'>https://neptune.ai/blog/image-segmentation</a>","metadata":{}},{"cell_type":"markdown","source":"<h2 style=\"font-family:verdana;\" align='center'>Thanks for reading! 😄</h2>","metadata":{}},{"cell_type":"code","source":"","metadata":{},"execution_count":null,"outputs":[]}]}