
First, I would like to thank the organizers and the community of the competition for a great challenge and very interesting time spent in the notebooks & discussions. Unfortunately, this time I was only a reader and will try to compensate it with this write-up. Please do not hesitate to comment or ask questions if you have any!
\nHere is the high level description of my solution for 16th place in the HMS - Harmful Brain Activity Classification competition, along with a bit more detailed dive in the most important topics.
\nThe final solution is 6 seeds ensemble on all the data (> 7 labels, <= 7 PLs), PLs for <= 7 voters part was also obtained by 10-seeds ensemble.
\nThe most helpful parts were selecting only quality labels with > 7 voters, plotting 1D as 2D, using global bipolar montages' normalization instead of per-object min-max, luck of the backbone selection and using large image size. PLs, usage of EMA and TTA introduced only minor (~0.001 order of magnitude) improvements. I have not properly measured the augmentations impact and only could state that adding them greatly reduced overfitting.
\nThe following supplementary materials paper helped with two things:
\n

Another thing covered here was train-test splitting strategy based on errors' equalization that could help to have more equal distribution of the hard samples in train and test, but I have not used it, sticking to the familiar StratifiedGroupKFold.
Here, the idea was to leverage 2D vision models and weights (esp. transformers architecture) and simultaneously show the model just the same picture as which was shown to the voters when they were labeling the data.
\n
That was achieved by converting everything in 2D as follows:
\nCompetition's data spectrograms with the following pre-processing:
\n [np.isnan(spectrogram)] = \n = np.log10(spectrogram + e-)\n , max_ = np.quantile(spectrogram, .), np.quantile(spectrogram, .)\n = np.clip(spectrogram, min_, max_)\n = (spectrogram - min_) / (max_ - min_)\nAnd @cdeotte's spectrograms with no additional pre-processing other than converting to [0, 1] range. Both specs were resized to 320 x 320 and concatenated vertically.
\nNext, EEG bipolar montages of central 20s were calculated, filtered in 1-70 Hz range excluding possible power line noise and normalized. Pre-calculated EEG_DIFF_ABS_MAX[i] values are mostly around 100 as 0.05 and 0.95 quantiles of the corresponding montages.
# 50 Hz & 60 Hz noise\n b, a = butter(5, (59, 61), =, =, =EED_SAMPLING_RATE_HZ)\n y = lfilter(b, a, y, =0)\n\n # Bandpass 1-70 Hz\n b, a = butter(5, (1, 70), =, =, =EED_SAMPLING_RATE_HZ)\n y = lfilter(b, a, y, =0)\n\n # Normalize\n min_, max_ = \\\n -2 * EEG_DIFF_ABS_MAX[i], \\\n 2 * EEG_DIFF_ABS_MAX[i]\n y = np.clip(y, min_, max_)\n y = (y - min_) / (max_ - min_)\n y[0] = 0\n y[-1] = 1\nThe 20 resulting montages were plotted to 2D array of size 640 x 1600 by justpyplot library, each covers up to 64 x 1600 area with overlaps and concatenated to the spectrograms. The total image size was 640 x 1920, find an example of the image below.

Initially I have selected the tiny_vit_21m_512.dist_in22k_ft_in1k model to experiment with as indeed tiny and fast to train. At some moment I have tried to use some other models, but it appears that it was distilled to be very powerful, so to reach its performance I needed e.g. hf_hub:timm/eva02_base_patch14_448.mim_in22k_ft_in22k_in1k model, which is ~ 5 times larger and much slower.
So, I could only recommend trying the mentioned TinyViT model in your problems!
\nEdit: here is the code of the solution in Pytorch / Lightning / Docker.
", "messages": [ { "id": "2742662", "postDate": "04/09/2024 02:49:33", "content": "First, I would like to thank the organizers and the community of the competition for a great challenge and very interesting time spent in the notebooks & discussions. Unfortunately, this time I was only a reader and will try to compensate it with this write-up. Please do not hesitate to comment or ask questions if you have any!
\nHere is the high level description of my solution for 16th place in the HMS - Harmful Brain Activity Classification competition, along with a bit more detailed dive in the most important topics.
\nThe final solution is 6 seeds ensemble on all the data (> 7 labels, <= 7 PLs), PLs for <= 7 voters part was also obtained by 10-seeds ensemble.
\nThe most helpful parts were selecting only quality labels with > 7 voters, plotting 1D as 2D, using global bipolar montages' normalization instead of per-object min-max, luck of the backbone selection and using large image size. PLs, usage of EMA and TTA introduced only minor (~0.001 order of magnitude) improvements. I have not properly measured the augmentations impact and only could state that adding them greatly reduced overfitting.
\nThe following supplementary materials paper helped with two things:
\n
Another thing covered here was train-test splitting strategy based on errors' equalization that could help to have more equal distribution of the hard samples in train and test, but I have not used it, sticking to the familiar StratifiedGroupKFold.
Here, the idea was to leverage 2D vision models and weights (esp. transformers architecture) and simultaneously show the model just the same picture as which was shown to the voters when they were labeling the data.
\n
That was achieved by converting everything in 2D as follows:
\nCompetition's data spectrograms with the following pre-processing:
\n [np.isnan(spectrogram)] = \n = np.log10(spectrogram + e-)\n , max_ = np.quantile(spectrogram, .), np.quantile(spectrogram, .)\n = np.clip(spectrogram, min_, max_)\n = (spectrogram - min_) / (max_ - min_)\nAnd @cdeotte's spectrograms with no additional pre-processing other than converting to [0, 1] range. Both specs were resized to 320 x 320 and concatenated vertically.
\nNext, EEG bipolar montages of central 20s were calculated, filtered in 1-70 Hz range excluding possible power line noise and normalized. Pre-calculated EEG_DIFF_ABS_MAX[i] values are mostly around 100 as 0.05 and 0.95 quantiles of the corresponding montages.
# 50 Hz & 60 Hz noise\n b, a = butter(5, (59, 61), =, =, =EED_SAMPLING_RATE_HZ)\n y = lfilter(b, a, y, =0)\n\n # Bandpass 1-70 Hz\n b, a = butter(5, (1, 70), =, =, =EED_SAMPLING_RATE_HZ)\n y = lfilter(b, a, y, =0)\n\n # Normalize\n min_, max_ = \\\n -2 * EEG_DIFF_ABS_MAX[i], \\\n 2 * EEG_DIFF_ABS_MAX[i]\n y = np.clip(y, min_, max_)\n y = (y - min_) / (max_ - min_)\n y[0] = 0\n y[-1] = 1\nThe 20 resulting montages were plotted to 2D array of size 640 x 1600 by justpyplot library, each covers up to 64 x 1600 area with overlaps and concatenated to the spectrograms. The total image size was 640 x 1920, find an example of the image below.
Initially I have selected the tiny_vit_21m_512.dist_in22k_ft_in1k model to experiment with as indeed tiny and fast to train. At some moment I have tried to use some other models, but it appears that it was distilled to be very powerful, so to reach its performance I needed e.g. hf_hub:timm/eva02_base_patch14_448.mim_in22k_ft_in22k_in1k model, which is ~ 5 times larger and much slower.
So, I could only recommend trying the mentioned TinyViT model in your problems!
\nEdit: here is the code of the solution in Pytorch / Lightning / Docker.
", "rawMarkdown": "# Overview\n\nFirst, I would like to thank the organizers and the community of the competition for a great challenge and very interesting time spent in the notebooks & discussions. Unfortunately, this time I was only a reader and will try to compensate it with this write-up. Please do not hesitate to comment or ask questions if you have any!\n\nHere is the high level description of my solution for 16th place in the HMS - Harmful Brain Activity Classification competition, along with a bit more detailed dive in the most important topics.\n\n- **Data:** competition's data 10min & @cdeotte's (big thanks to him!) 50s spectrograms concatenated with plots of normalized EEG bipolar montages\n- **Model:** timm's tinyViT as a backbone (the best quality / speed ratio)\n- **Training:** stage 1 training with only > 7 voters, stage 2 by pseudolabeling (PL) the rest of the data & re-training\n- **Augmentations:** random selection of EEG-sub-id, channel flipping of left-side and right-side electrodes in raw EEGs and spectrograms, image augs: coarse dropout + brightness / contrast\n- **Other:** cosine LR schedule w warm-up, EMA with decay 0.8, TTA by flipping\n\nThe final solution is 6 seeds ensemble on all the data (> 7 labels, <= 7 PLs), PLs for <= 7 voters part was also obtained by 10-seeds ensemble.\n\nThe most helpful parts were selecting only quality labels with > 7 voters, plotting 1D as 2D, using global bipolar montages' normalization instead of per-object min-max, luck of the backbone selection and using large image size. PLs, usage of EMA and TTA introduced only minor (~0.001 order of magnitude) improvements. I have not properly measured the augmentations impact and only could state that adding them greatly reduced overfitting.\n\n# Some insights from the papers\n\nThe following supplementary materials [paper](https://cdn-links.lww.com/permalink/wnl/c/wnl_2023_02_26_westover_1_sdc1.pdf) helped with two things: \n\n1. Answer to the question: does test data contain only objects with high number of voters?\n\n\n \n2. Channel flipping augmentation.\n\n\n\nAnother thing covered here was train-test splitting strategy based on errors' equalization that could help to have more equal distribution of the hard samples in train and test, but I have not used it, sticking to the familiar `StratifiedGroupKFold`.\n\n# Data\n\nHere, the idea was to leverage 2D vision models and weights (esp. transformers architecture) and simultaneously show the model just the same picture as which was shown to the voters when they were labeling the data. \n\n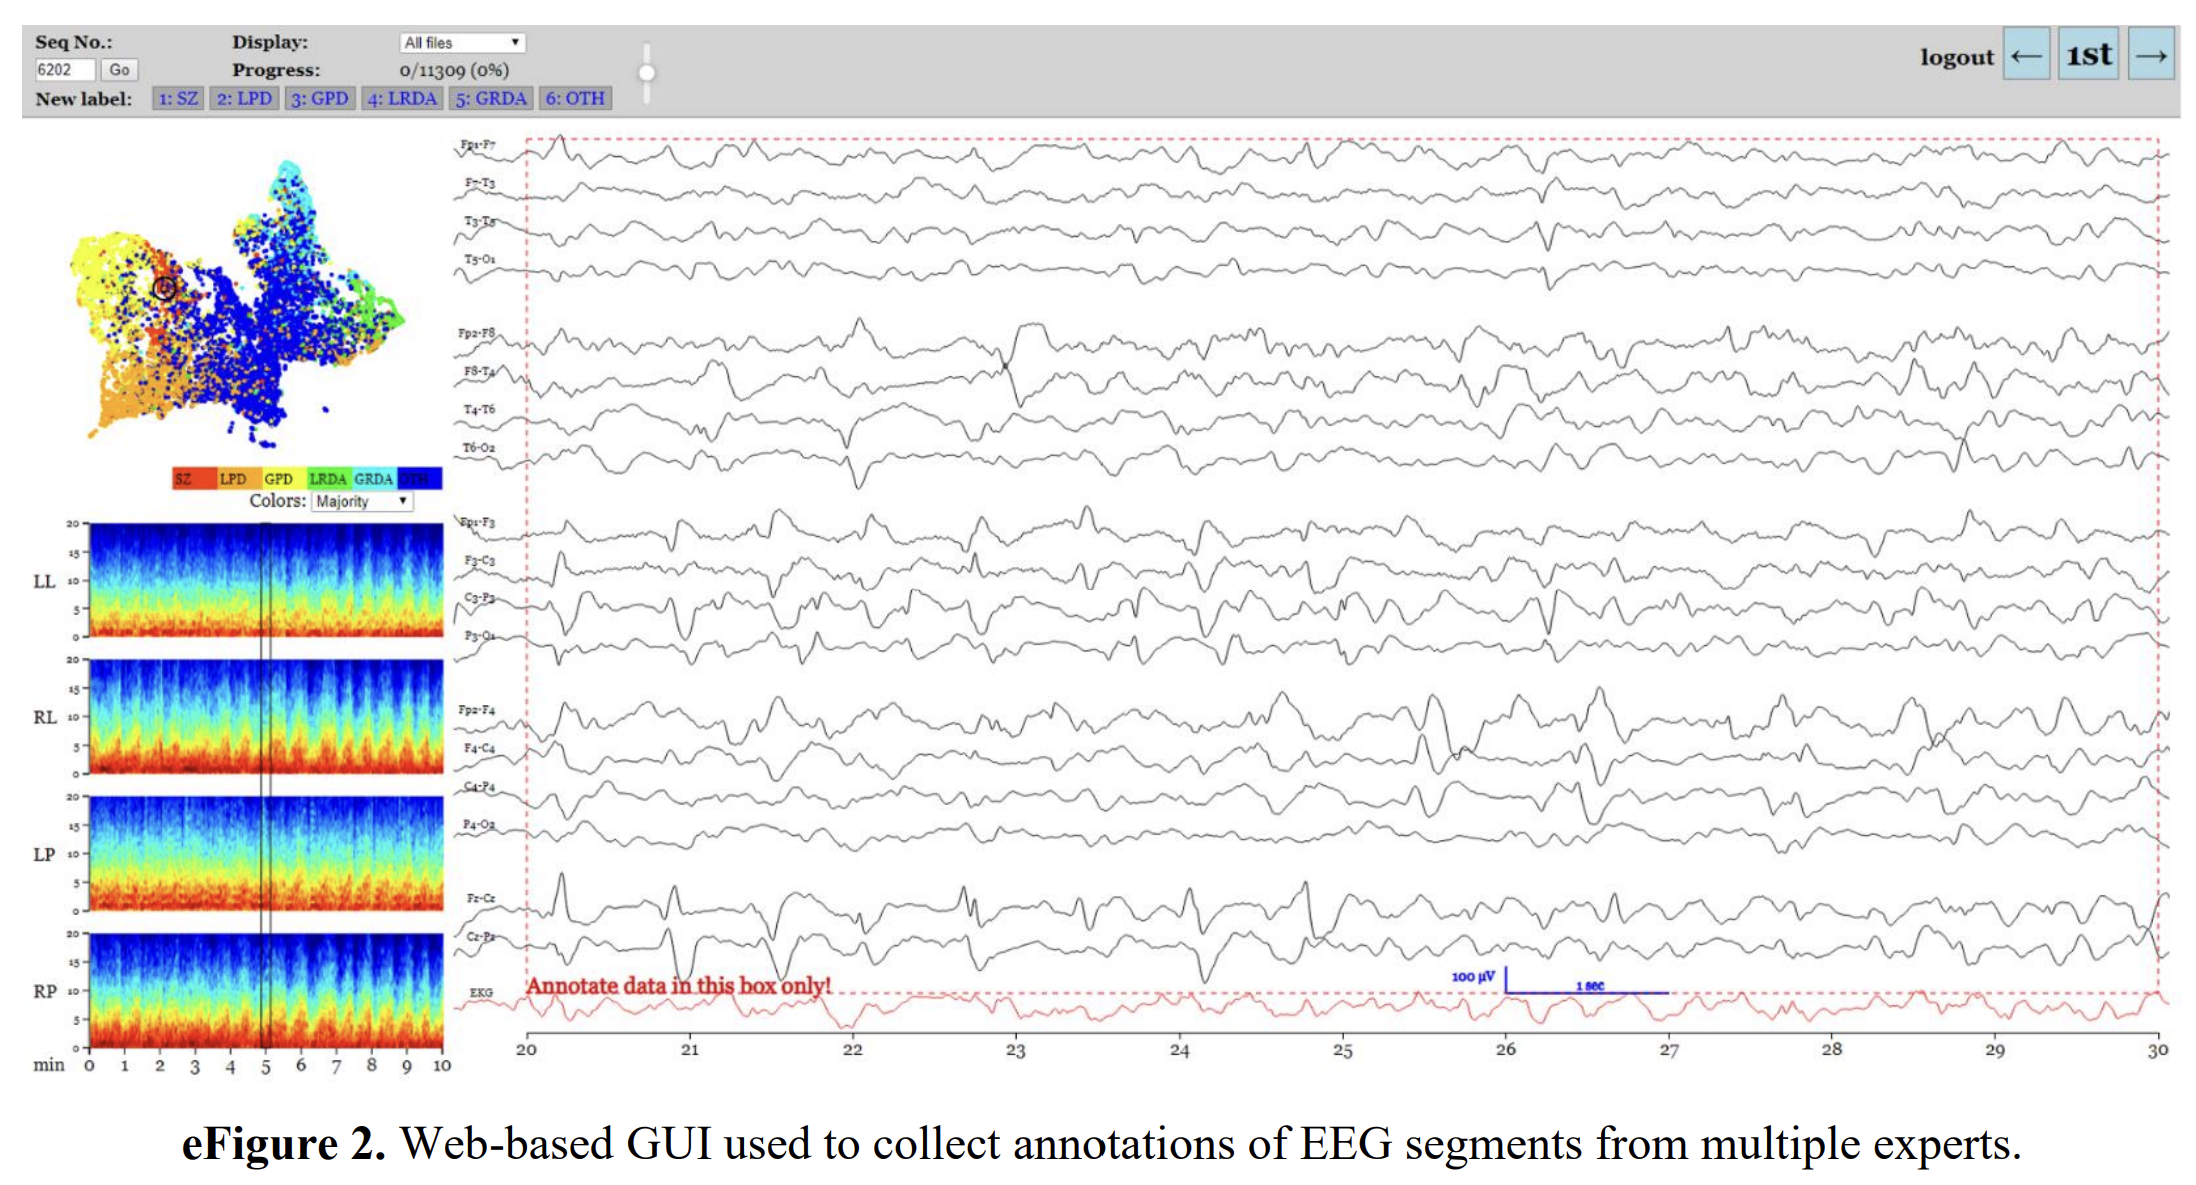\n\nThat was achieved by converting everything in 2D as follows:\n\nCompetition's data spectrograms with the following pre-processing:\n\n```\n spectrogram[np.isnan(spectrogram)] = 0\n spectrogram = np.log10(spectrogram + 1e-6)\n min_, max_ = np.quantile(spectrogram, 0.01), np.quantile(spectrogram, 0.99)\n spectrogram = np.clip(spectrogram, min_, max_)\n spectrogram = (spectrogram - min_) / (max_ - min_)\n```\n\nAnd @cdeotte's spectrograms with no additional pre-processing other than converting to [0, 1] range. Both specs were resized to 320 x 320 and concatenated vertically.\n\nNext, EEG bipolar montages of central 20s were calculated, filtered in 1-70 Hz range excluding possible power line noise and normalized. Pre-calculated `EEG_DIFF_ABS_MAX[i]` values are mostly around 100 as 0.05 and 0.95 quantiles of the corresponding montages.\n\n```\n # Remove 50 Hz & 60 Hz noise\n b, a = butter(5, (59, 61), btype='bandstop', analog=False, fs=EED_SAMPLING_RATE_HZ)\n y = lfilter(b, a, y, axis=0)\n\n # Bandpass 1-70 Hz\n b, a = butter(5, (1, 70), btype='bandpass', analog=False, fs=EED_SAMPLING_RATE_HZ)\n y = lfilter(b, a, y, axis=0)\n\n # Normalize\n min_, max_ = \\\n -2 * EEG_DIFF_ABS_MAX[i], \\\n 2 * EEG_DIFF_ABS_MAX[i]\n y = np.clip(y, min_, max_)\n y = (y - min_) / (max_ - min_)\n y[0] = 0\n y[-1] = 1\n```\n\nThe 20 resulting montages were plotted to 2D array of size 640 x 1600 by `justpyplot` library, each covers up to 64 x 1600 area with overlaps and concatenated to the spectrograms. The total image size was 640 x 1920, find an example of the image below.\n\n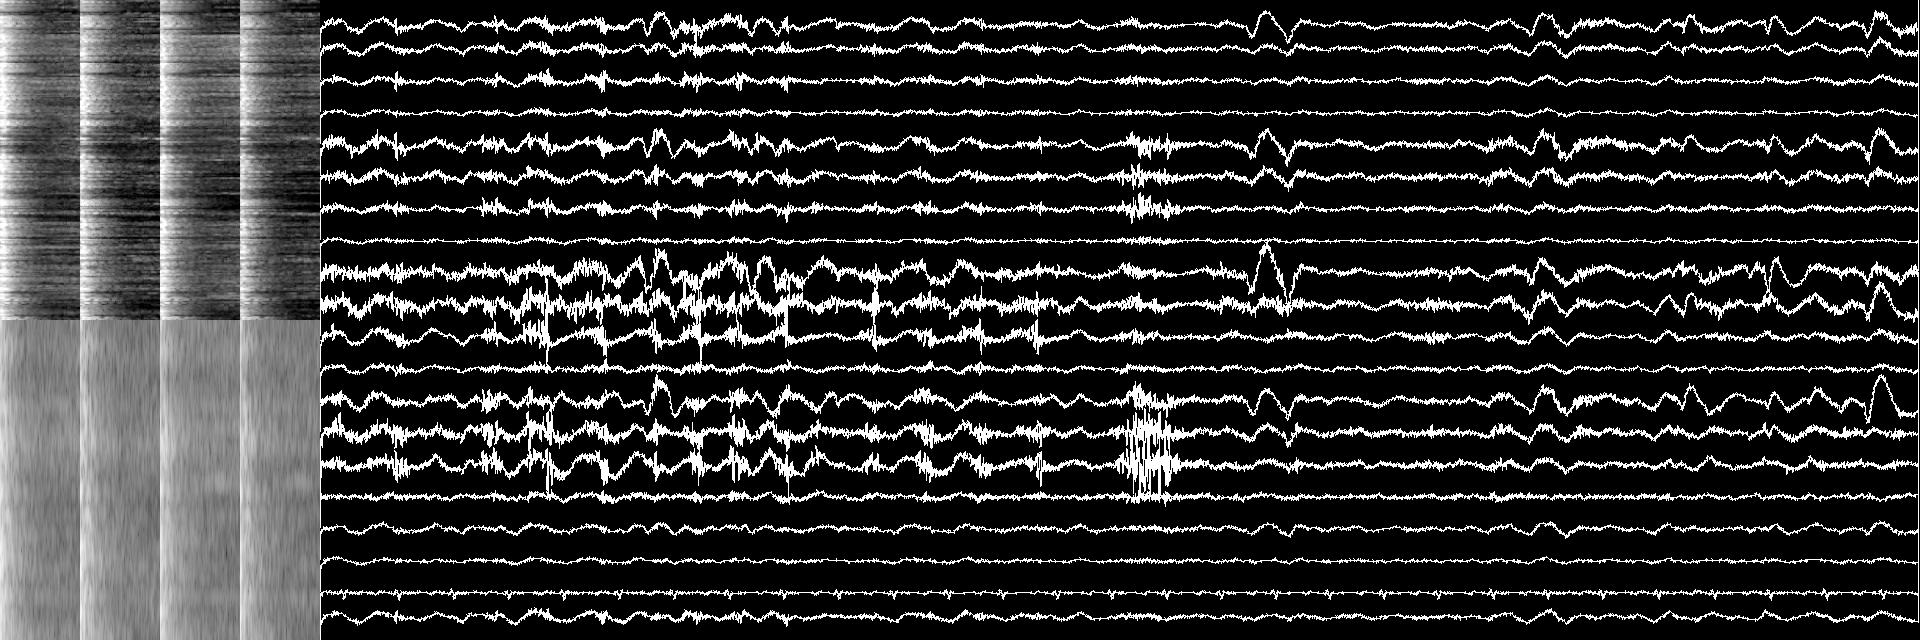\n\n# Model\n\nInitially I have selected the `tiny_vit_21m_512.dist_in22k_ft_in1k` model to experiment with as indeed tiny and fast to train. At some moment I have tried to use some other models, but it appears that it was distilled to be very powerful, so to reach its performance I needed e.g. `hf_hub:timm/eva02_base_patch14_448.mim_in22k_ft_in22k_in1k` model, which is ~ 5 times larger and much slower. \n\nSo, I could only recommend trying the mentioned TinyViT model in your problems!\n\n**Edit:** here is the [code](https://github.com/mkotyushev/hms) of the solution in Pytorch / Lightning / Docker.", "votes": null }, { "id": "2742682", "postDate": "04/09/2024 03:00:04", "content": "Thank you for really good solution and congratulation!
\nSo did you input image of 640 x 1920 into model tiny_vit_21m_512.dist_in22k_ft_in1k?
\nAnd Can I ask your Best CV?
thank you for sharing your code, there's a lot must to learn especially signal processing…
", "rawMarkdown": "thank you for sharing your code, there's a lot must to learn especially signal processing...", "votes": null }, { "id": "2743600", "postDate": "04/09/2024 14:38:19", "content": "Cool idea to try and match what the voters saw. Nice solution!
", "rawMarkdown": "Cool idea to try and match what the voters saw. Nice solution!", "votes": null }, { "id": "2743636", "postDate": "04/09/2024 15:00:19", "content": "Hi, thanks! Yes, the model is tiny_vit_21m_512.dist_in22k_ft_in1k adapted for 1 channel input (first convolution weight summed) and the 640 x 1920 image is fed into it.
For CV: 5-fold average KL is ~0.235 (see fig), but the final solution is trained on the full data, so no validation done, and I trusted public LB here. Public LB was 0.24 for stage 1 (10 seeds, no PLs) and 0.23 for stage 2 (6 seeds with PLs generated by stage 1 models), and private was 0.29 for both stages.
\n
Could you please share which web-based UI is in the picture you shared in this post?
", "rawMarkdown": "Could you please share which web-based UI is in the picture you shared in this post?", "votes": null } ], "comments": [ { "id": 2742682, "author_name": "haruki741", "author_url": "", "post_date": "04/09/2024 03:00:04", "content": "Thank you for really good solution and congratulation!
\nSo did you input image of 640 x 1920 into model tiny_vit_21m_512.dist_in22k_ft_in1k?
\nAnd Can I ask your Best CV?
Hi, thanks! Yes, the model is tiny_vit_21m_512.dist_in22k_ft_in1k adapted for 1 channel input (first convolution weight summed) and the 640 x 1920 image is fed into it.
For CV: 5-fold average KL is ~0.235 (see fig), but the final solution is trained on the full data, so no validation done, and I trusted public LB here. Public LB was 0.24 for stage 1 (10 seeds, no PLs) and 0.23 for stage 2 (6 seeds with PLs generated by stage 1 models), and private was 0.29 for both stages.
\n
thank you for sharing your code, there's a lot must to learn especially signal processing…
", "votes": null, "replies": [] }, { "id": 2743600, "author_name": "brendanartley", "author_url": "", "post_date": "04/09/2024 14:38:19", "content": "Cool idea to try and match what the voters saw. Nice solution!
", "votes": null, "replies": [] }, { "id": 2971370, "author_name": "deepak412", "author_url": "", "post_date": "08/27/2024 05:47:16", "content": "Could you please share which web-based UI is in the picture you shared in this post?
", "votes": null, "replies": [] } ], "raw_markdown_by_id": { "2742662": "# Overview\n\nFirst, I would like to thank the organizers and the community of the competition for a great challenge and very interesting time spent in the notebooks & discussions. Unfortunately, this time I was only a reader and will try to compensate it with this write-up. Please do not hesitate to comment or ask questions if you have any!\n\nHere is the high level description of my solution for 16th place in the HMS - Harmful Brain Activity Classification competition, along with a bit more detailed dive in the most important topics.\n\n- **Data:** competition's data 10min & @cdeotte's (big thanks to him!) 50s spectrograms concatenated with plots of normalized EEG bipolar montages\n- **Model:** timm's tinyViT as a backbone (the best quality / speed ratio)\n- **Training:** stage 1 training with only > 7 voters, stage 2 by pseudolabeling (PL) the rest of the data & re-training\n- **Augmentations:** random selection of EEG-sub-id, channel flipping of left-side and right-side electrodes in raw EEGs and spectrograms, image augs: coarse dropout + brightness / contrast\n- **Other:** cosine LR schedule w warm-up, EMA with decay 0.8, TTA by flipping\n\nThe final solution is 6 seeds ensemble on all the data (> 7 labels, <= 7 PLs), PLs for <= 7 voters part was also obtained by 10-seeds ensemble.\n\nThe most helpful parts were selecting only quality labels with > 7 voters, plotting 1D as 2D, using global bipolar montages' normalization instead of per-object min-max, luck of the backbone selection and using large image size. PLs, usage of EMA and TTA introduced only minor (~0.001 order of magnitude) improvements. I have not properly measured the augmentations impact and only could state that adding them greatly reduced overfitting.\n\n# Some insights from the papers\n\nThe following supplementary materials [paper](https://cdn-links.lww.com/permalink/wnl/c/wnl_2023_02_26_westover_1_sdc1.pdf) helped with two things: \n\n1. Answer to the question: does test data contain only objects with high number of voters?\n\n\n \n2. Channel flipping augmentation.\n\n\n\nAnother thing covered here was train-test splitting strategy based on errors' equalization that could help to have more equal distribution of the hard samples in train and test, but I have not used it, sticking to the familiar `StratifiedGroupKFold`.\n\n# Data\n\nHere, the idea was to leverage 2D vision models and weights (esp. transformers architecture) and simultaneously show the model just the same picture as which was shown to the voters when they were labeling the data. \n\n\n\nThat was achieved by converting everything in 2D as follows:\n\nCompetition's data spectrograms with the following pre-processing:\n\n```\n spectrogram[np.isnan(spectrogram)] = 0\n spectrogram = np.log10(spectrogram + 1e-6)\n min_, max_ = np.quantile(spectrogram, 0.01), np.quantile(spectrogram, 0.99)\n spectrogram = np.clip(spectrogram, min_, max_)\n spectrogram = (spectrogram - min_) / (max_ - min_)\n```\n\nAnd @cdeotte's spectrograms with no additional pre-processing other than converting to [0, 1] range. Both specs were resized to 320 x 320 and concatenated vertically.\n\nNext, EEG bipolar montages of central 20s were calculated, filtered in 1-70 Hz range excluding possible power line noise and normalized. Pre-calculated `EEG_DIFF_ABS_MAX[i]` values are mostly around 100 as 0.05 and 0.95 quantiles of the corresponding montages.\n\n```\n # Remove 50 Hz & 60 Hz noise\n b, a = butter(5, (59, 61), btype='bandstop', analog=False, fs=EED_SAMPLING_RATE_HZ)\n y = lfilter(b, a, y, axis=0)\n\n # Bandpass 1-70 Hz\n b, a = butter(5, (1, 70), btype='bandpass', analog=False, fs=EED_SAMPLING_RATE_HZ)\n y = lfilter(b, a, y, axis=0)\n\n # Normalize\n min_, max_ = \\\n -2 * EEG_DIFF_ABS_MAX[i], \\\n 2 * EEG_DIFF_ABS_MAX[i]\n y = np.clip(y, min_, max_)\n y = (y - min_) / (max_ - min_)\n y[0] = 0\n y[-1] = 1\n```\n\nThe 20 resulting montages were plotted to 2D array of size 640 x 1600 by `justpyplot` library, each covers up to 64 x 1600 area with overlaps and concatenated to the spectrograms. The total image size was 640 x 1920, find an example of the image below.\n\n\n\n# Model\n\nInitially I have selected the `tiny_vit_21m_512.dist_in22k_ft_in1k` model to experiment with as indeed tiny and fast to train. At some moment I have tried to use some other models, but it appears that it was distilled to be very powerful, so to reach its performance I needed e.g. `hf_hub:timm/eva02_base_patch14_448.mim_in22k_ft_in22k_in1k` model, which is ~ 5 times larger and much slower. \n\nSo, I could only recommend trying the mentioned TinyViT model in your problems!\n\n**Edit:** here is the [code](https://github.com/mkotyushev/hms) of the solution in Pytorch / Lightning / Docker.", "2742682": "Thank you for really good solution and congratulation!\nSo did you input image of 640 x 1920 into model `tiny_vit_21m_512.dist_in22k_ft_in1k`?\nAnd Can I ask your Best CV?", "2742781": "thank you for sharing your code, there's a lot must to learn especially signal processing...", "2743600": "Cool idea to try and match what the voters saw. Nice solution!", "2743636": "Hi, thanks! Yes, the model is `tiny_vit_21m_512.dist_in22k_ft_in1k` adapted for 1 channel input (first convolution weight summed) and the 640 x 1920 image is fed into it. \n\nFor CV: 5-fold average KL is ~0.235 (see fig), but the final solution is trained on the full data, so no validation done, and I trusted public LB here. Public LB was 0.24 for stage 1 (10 seeds, no PLs) and 0.23 for stage 2 (6 seeds with PLs generated by stage 1 models), and private was 0.29 for both stages.\n\n", "2971370": "Could you please share which web-based UI is in the picture you shared in this post?" }, "source": "meta" }