{"metadata":{"kernelspec":{"language":"python","display_name":"Python 3","name":"python3"},"language_info":{"pygments_lexer":"ipython3","nbconvert_exporter":"python","version":"3.6.4","file_extension":".py","codemirror_mode":{"name":"ipython","version":3},"name":"python","mimetype":"text/x-python"}},"nbformat_minor":4,"nbformat":4,"cells":[{"cell_type":"markdown","source":"Taxonomy prediction
\n\n\"Taxonomy prediction is a science involving the hierarchical classification of DNA fragments up to the rank species. Given species diversity on Earth, taxonomy prediction gets challenging with (i) increasing number of species (labels) to classify and (ii) decreasing input (DNA) size.\"\n\nhttps://vtechworks.lib.vt.edu/handle/10919/89752","metadata":{}},{"cell_type":"markdown","source":"Accuracy of taxonomy prediction for 16S rRNA and fungal ITS sequences\n\nAuthor: Robert C. Edgar\n\n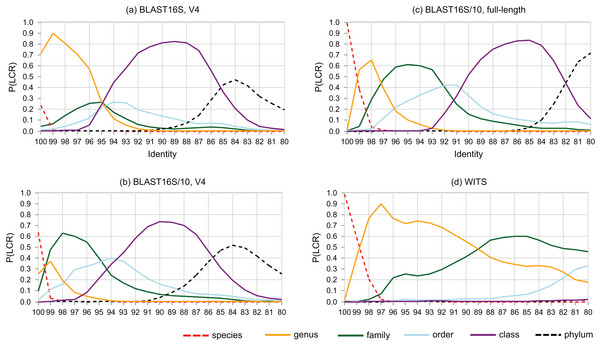https://peerj.com/articles/4652/","metadata":{}},{"cell_type":"code","source":"import numpy as np # linear algebra\nimport pandas as pd\nfrom pathlib import Path\nimport os.path\nimport matplotlib.pyplot as plt\nimport tensorflow as tf\nimport seaborn as sns","metadata":{"_uuid":"8f2839f25d086af736a60e9eeb907d3b93b6e0e5","_cell_guid":"b1076dfc-b9ad-4769-8c92-a6c4dae69d19","_kg_hide-input":true,"_kg_hide-output":true,"execution":{"iopub.status.busy":"2022-02-19T22:29:15.189712Z","iopub.execute_input":"2022-02-19T22:29:15.190271Z","iopub.status.idle":"2022-02-19T22:29:22.348967Z","shell.execute_reply.started":"2022-02-19T22:29:15.190145Z","shell.execute_reply":"2022-02-19T22:29:22.34786Z"},"trusted":true},"execution_count":null,"outputs":[]},{"cell_type":"markdown","source":"Deep Learning for Taxonomy Prediction
\n\n\"Deep Learning for Taxonomy Prediction\"\n\n\"The last decade has seen great advances in Next-Generation Sequencing technologies, and, as a result, there has been a rise in the number of genomes sequenced each year. In 2017, there were as many as 10,000 new organisms sequenced and added into the RefSeq Database.\"\n\n\"Taxonomy prediction is a science involving the hierarchical classification of DNA fragments up to the rank species. In this research, the authors introduced Predicting Linked Organisms, Plinko, for short. Plinko is a fully-functioning, state-of-the-art predictive system that accurately captures DNA - Taxonomy relationships where other state-of-the-art algorithms falter.\"\n\n\"Plinko leverages multi-view CNNs and the pre-defined taxonomy tree structure to improve multi-level taxonomy prediction. In the Plinko strategy, each network takes advantage of different word usage patterns corresponding to different levels of evolutionary divergence. Plinko has the advantages of relatively low storage, GPGPU parallel training and inference, making the solution portable, and scalable with anticipated genome database growth.\"\n\n\"To the best of our knowledge, Plinko is the first to use multi-view CNN as the core algorithm in a compositional,alignment-free approach to taxonomy prediction.\"\n\nhttps://vtechworks.lib.vt.edu/handle/10919/89752","metadata":{}},{"cell_type":"code","source":"#Code by Ventakumar R https://www.kaggle.com/venkatkumar001/hfp-2-eda-tensorflow/notebook\n\nimport json, codecs\n\nwith codecs.open(\"../input/herbarium-2022-fgvc9/train_metadata.json\", 'r',\n encoding='utf-8', errors='ignore') as f:\n train_meta = json.load(f)\n \nwith codecs.open(\"../input/herbarium-2022-fgvc9/test_metadata.json\", 'r',\n encoding='utf-8', errors='ignore') as f:\n test_meta = json.load(f)","metadata":{"execution":{"iopub.status.busy":"2022-02-19T22:32:38.246063Z","iopub.execute_input":"2022-02-19T22:32:38.24672Z","iopub.status.idle":"2022-02-19T22:32:49.851742Z","shell.execute_reply.started":"2022-02-19T22:32:38.246677Z","shell.execute_reply":"2022-02-19T22:32:49.850744Z"},"trusted":true},"execution_count":null,"outputs":[]},{"cell_type":"markdown","source":"Taxonomy relationships
\n\n\"Taxonomy prediction is a science involving the hierarchical classification of DNA fragments up to the rank species. Given species diversity on Earth, taxonomy prediction gets challenging with (i) increasing number of species (labels) to classify and (ii) decreasing input (DNA) size.\"\n\n\"In that research, the authors introduced Predicting Linked Organisms, Plinko, for short. Plinko is a fully-functioning, state-of-the-art predictive system that accurately captures DNA - Taxonomy relationships where other state-of-the-art algorithms falter.\"\n\n\"Three major challenges in taxonomy prediction are (i) large dataset sizes (order of 109 sequences) (ii) large label spaces (order of 103 labels) and (iii) low resolution inputs (100 base pairs or less). Plinko leverages multi-view CNNs and the pre-defined taxonomy tree structure to improve multi-level taxonomy prediction for hard to classify sequences under the three conditions stated.\"\n\n\"Plinko has the advantage of relatively low storage footprint, making the solution portable, and scalable with anticipated genome database growth. To the best of our knowledge, Plinko is the first to use multi-view CNN as the core algorithm in a compositional, alignment-free approach to taxonomy prediction.\"\n\nhttps://vtechworks.lib.vt.edu/handle/10919/89752","metadata":{}},{"cell_type":"code","source":"#Code by Ventakumar R https://www.kaggle.com/venkatkumar001/hfp-2-eda-tensorflow/notebook\n\ndisplay(train_meta.keys())","metadata":{"execution":{"iopub.status.busy":"2022-02-19T22:38:16.812229Z","iopub.execute_input":"2022-02-19T22:38:16.812683Z","iopub.status.idle":"2022-02-19T22:38:16.827186Z","shell.execute_reply.started":"2022-02-19T22:38:16.812643Z","shell.execute_reply":"2022-02-19T22:38:16.826445Z"},"_kg_hide-output":true,"trusted":true},"execution_count":null,"outputs":[]},{"cell_type":"markdown","source":"Taxonomy Prediction with Tree-Structured Covariances
\n\nTaxonomic Prediction with Tree-Structured Covariances\n\nAuthors: Matthew B. Blaschko, Wojciech Zaremba, Arthur Gretton \nDOI https://doi.org/10.1007/978-3-642-40991-2_20\n\n\"Taxonomies have been proposed numerous times in the literature in order to encode semantic relationships between classes. Such taxonomies have been used to improve classification results by increasing the statistical efficiency of learning, as similarities between classes can be used to increase the amount of relevant data during training.\"\n\n\"In that paper, the authors show how data-derived taxonomies may be used in a structured prediction framework, and compare the performance of learned and semantically constructed taxonomies. Structured prediction in this case is multi-class categorization with the assumption that categories are taxonomically related.\"\n\n\"They made three main contributions: (i) They proved the equivalence between tree-structured covariance matrices and taxonomies; (ii) They used this covariance representation to develop a highly computationally efficient optimization algorithm for structured prediction with taxonomies; (iii) They showed that the taxonomies learned from data using the Hilbert- Schmidt Independence Criterion (HSIC) often perform better than imputed semantic taxonomies.\"\n\n\"Source code of this implementation, as well as machine readable learned taxonomies are available for download from https://github.com/blaschko/tree-structured-covariance.\"\n\nhttps://link.springer.com/chapter/10.1007/978-3-642-40991-2_20","metadata":{}},{"cell_type":"code","source":"#Code by Ventakumar R https://www.kaggle.com/venkatkumar001/hfp-2-eda-tensorflow/notebook\n\ntaxonomy = pd.DataFrame(train_meta['categories'])\n#train_cat.columns = [ 'category_id', 'scientificName','family', 'genus']\ndisplay(taxonomy)","metadata":{"execution":{"iopub.status.busy":"2022-02-19T22:39:32.295516Z","iopub.execute_input":"2022-02-19T22:39:32.296418Z","iopub.status.idle":"2022-02-19T22:39:32.386176Z","shell.execute_reply.started":"2022-02-19T22:39:32.296367Z","shell.execute_reply":"2022-02-19T22:39:32.385423Z"},"trusted":true},"execution_count":null,"outputs":[]},{"cell_type":"markdown","source":"Accuracy of Taxonomy Prediction
\n\n\"Accuracy of taxonomy prediction for 16S rRNA and fungal ITS sequences\"\n\nAuthor: Robert C. Edgar\n\n\"Prediction of taxonomy for marker gene sequences such as 16S ribosomal RNA (rRNA) is a fundamental task in microbiology. Most experimentally observed sequences are diverged from reference sequences of authoritatively named organisms, creating a challenge for prediction methods.\"\n\n\"The author assessed the accuracy of several algorithms using cross-validation by identity, a new benchmark strategy which explicitly models the variation in distances between query sequences and the closest entry in a reference database. When the accuracy of genus predictions was averaged over a representative range of identities with the reference database (100%, 99%, 97%, 95% and 90%), all tested methods had ≤50% accuracy on the currently-popular V4 region of 16S rRNA.\"\n\n\"Accuracy was found to fall rapidly with identity; for example, better methods were found to have V4 genus prediction accuracy of ∼100% at 100% identity but ∼50% at 97% identity. The relationship between identity and taxonomy was quantified as the probability that a rank is the lowest shared by a pair of sequences with a given pair-wise identity. With the V4 region, 95% identity was found to be a twilight zone where taxonomy is highly ambiguous because the probabilities that the lowest shared rank between pairs of sequences is genus, family, order or class are approximately equal.\"\n\nhttps://peerj.com/articles/4652/\n","metadata":{}},{"cell_type":"code","source":"taxonomy[\"family\"].value_counts()","metadata":{"execution":{"iopub.status.busy":"2022-02-19T22:40:45.109595Z","iopub.execute_input":"2022-02-19T22:40:45.110105Z","iopub.status.idle":"2022-02-19T22:40:45.131708Z","shell.execute_reply.started":"2022-02-19T22:40:45.11007Z","shell.execute_reply":"2022-02-19T22:40:45.130881Z"},"_kg_hide-output":true,"trusted":true},"execution_count":null,"outputs":[]},{"cell_type":"markdown","source":"Plants Conservation Relevant Predictions
\n\n\"The conservation status of most plant species is currently unknown, despite the fundamental role of plants in ecosystem health. To facilitate the costly process of conservation assessment, the authors developed a predictive protocol using a ML approach to predict conservation status of over 150,000 land plant species. Our study uses open-source geographic, environmental, and morphological trait data, making this the largest assessment of conservation risk to date and the only global assessment for plants.\"\n\n\"Their results indicated that a large number of unassessed species are likely at risk and identify several geographic regions with the highest need of conservation efforts, many of which are not currently recognized as regions of global concern.\"\n\n\"By providing conservation-relevant predictions at multiple spatial and taxonomic scales, predictive frameworks such as the one developed here fill a pressing need for biodiversity science.\"\n\nhttps://www.pnas.org/content/115/51/13027","metadata":{}},{"cell_type":"code","source":"#Codes by Pooja Jain https://www.kaggle.com/jainpooja/av-guided-hackathon-predict-youtube-likes/notebook\n\nimport matplotlib.pyplot as plt\nimport seaborn as sns\n\ntext_cols = ['scientificName', 'family', 'genus', 'species']\n\nfrom wordcloud import WordCloud, STOPWORDS\n\nwc = WordCloud(stopwords = set(list(STOPWORDS) + ['|']), random_state = 42, background_color='green',colormap=\"Dark2\",)\nfig, axes = plt.subplots(2, 2, figsize=(20, 12))\naxes = [ax for axes_row in axes for ax in axes_row]\n\nfor i, c in enumerate(text_cols):\n op = wc.generate(str(taxonomy[c]))\n _ = axes[i].imshow(op)\n _ = axes[i].set_title(c.upper(), fontsize=24)\n _ = axes[i].axis('off')\n\n#_ = fig.delaxes(axes[3])\n_ = axes[i].axis('off')","metadata":{"execution":{"iopub.status.busy":"2022-02-19T22:43:47.486709Z","iopub.execute_input":"2022-02-19T22:43:47.487069Z","iopub.status.idle":"2022-02-19T22:43:48.846552Z","shell.execute_reply.started":"2022-02-19T22:43:47.48703Z","shell.execute_reply":"2022-02-19T22:43:48.845461Z"},"_kg_hide-input":true,"trusted":true},"execution_count":null,"outputs":[]},{"cell_type":"code","source":"import holoviews as hv\nfrom holoviews import opts\nhv.extension('bokeh')","metadata":{"execution":{"iopub.status.busy":"2022-02-19T22:45:18.371743Z","iopub.execute_input":"2022-02-19T22:45:18.372048Z","iopub.status.idle":"2022-02-19T22:45:22.128211Z","shell.execute_reply.started":"2022-02-19T22:45:18.372017Z","shell.execute_reply":"2022-02-19T22:45:22.127161Z"},"trusted":true},"execution_count":null,"outputs":[]},{"cell_type":"code","source":"#Code by Kohei-mu https://www.kaggle.com/koheimuramatsu/industrial-accident-causal-analysis/notebook\n\n#Fixed by Des https://www.kaggle.com/desalegngeb/bokeh-visualization-library-guide-for-beginners\n\nfamily_cnt = np.round((taxonomy['family'].value_counts(normalize=True) *100).head(10))\nhv.Bars(family_cnt[::-1]).opts(title=\"North America Flora Families\", color=\"purple\", xlabel=\"Flora Families\", ylabel=\"Percentage\", xformatter='%d%%')\\\n .opts(opts.Bars(width=600, height=600,tools=['hover'],show_grid=True,invert_axes=True))","metadata":{"execution":{"iopub.status.busy":"2022-02-19T22:45:35.854396Z","iopub.execute_input":"2022-02-19T22:45:35.854706Z","iopub.status.idle":"2022-02-19T22:45:36.040445Z","shell.execute_reply.started":"2022-02-19T22:45:35.854671Z","shell.execute_reply":"2022-02-19T22:45:36.039445Z"},"_kg_hide-input":true,"trusted":true},"execution_count":null,"outputs":[]},{"cell_type":"code","source":"#Code by Taha07 https://www.kaggle.com/taha07/data-scientists-jobs-analysis-visualization/notebook\n\ncolor = plt.cm.Greens(np.linspace(0,1,20))\ntaxonomy [\"scientificName\"].value_counts().sort_values(ascending=False).head(20).plot.pie(y=\"category_id\",colors=color,autopct=\"%0.1f%%\")\nplt.title(\"North America Flora Scientific Names\")\nplt.axis(\"off\")\nplt.show()","metadata":{"execution":{"iopub.status.busy":"2022-02-19T22:46:02.325955Z","iopub.execute_input":"2022-02-19T22:46:02.326587Z","iopub.status.idle":"2022-02-19T22:46:02.766312Z","shell.execute_reply.started":"2022-02-19T22:46:02.326548Z","shell.execute_reply":"2022-02-19T22:46:02.765485Z"},"_kg_hide-input":true,"trusted":true},"execution_count":null,"outputs":[]},{"cell_type":"code","source":"ax = taxonomy['scientificName'].value_counts()[:20].plot.barh(figsize=(16, 8), color='green')\nax.set_title('North America Flora Scientific Names', size=18, color='orange')\nax.set_ylabel('Scientific Names', size=10)\nax.set_xlabel('Count', size=10);","metadata":{"execution":{"iopub.status.busy":"2022-02-19T22:46:11.1656Z","iopub.execute_input":"2022-02-19T22:46:11.16605Z","iopub.status.idle":"2022-02-19T22:46:11.609785Z","shell.execute_reply.started":"2022-02-19T22:46:11.166006Z","shell.execute_reply":"2022-02-19T22:46:11.608848Z"},"_kg_hide-input":true,"trusted":true},"execution_count":null,"outputs":[]},{"cell_type":"code","source":"#Code by Taha07 https://www.kaggle.com/taha07/data-scientists-jobs-analysis-visualization/notebook\n\ncolor = plt.cm.viridis(np.linspace(0,1,20))\ntaxonomy [\"family\"].value_counts().sort_values(ascending=False).head(20).plot.pie(y=\"category_id\",colors=color,autopct=\"%0.1f%%\")\nplt.title(\"North America Flora Families\")\nplt.axis(\"off\")\nplt.show()","metadata":{"_kg_hide-input":true,"execution":{"iopub.status.busy":"2022-02-19T22:46:20.168066Z","iopub.execute_input":"2022-02-19T22:46:20.16837Z","iopub.status.idle":"2022-02-19T22:46:20.521632Z","shell.execute_reply.started":"2022-02-19T22:46:20.168334Z","shell.execute_reply":"2022-02-19T22:46:20.520531Z"},"trusted":true},"execution_count":null,"outputs":[]},{"cell_type":"code","source":"ax = taxonomy['family'].value_counts()[:20].plot.barh(figsize=(16, 8), color='orange')\nax.set_title('North America Flora Families', size=18, color='green')\nax.set_ylabel('Families', size=10)\nax.set_xlabel('Count', size=10);","metadata":{"execution":{"iopub.status.busy":"2022-02-19T22:46:29.512174Z","iopub.execute_input":"2022-02-19T22:46:29.512545Z","iopub.status.idle":"2022-02-19T22:46:29.892815Z","shell.execute_reply.started":"2022-02-19T22:46:29.51251Z","shell.execute_reply":"2022-02-19T22:46:29.891795Z"},"_kg_hide-input":true,"trusted":true},"execution_count":null,"outputs":[]},{"cell_type":"code","source":"#Code by Kohei-mu https://www.kaggle.com/koheimuramatsu/industrial-accident-causal-analysis/notebook\n\n#Fixed by Des https://www.kaggle.com/desalegngeb/bokeh-visualization-library-guide-for-beginners\n\ngenus_cnt = np.round((taxonomy['genus'].value_counts(normalize=True) *100).head(10))\nhv.Bars(genus_cnt[::-1]).opts(title=\"North America Flora Genus\", color=\"red\", xlabel=\"Flora Genus\", ylabel=\"Percentage\", xformatter='%d%%')\\\n .opts(opts.Bars(width=600, height=600,tools=['hover'],show_grid=True,invert_axes=True))","metadata":{"execution":{"iopub.status.busy":"2022-02-19T22:46:39.304272Z","iopub.execute_input":"2022-02-19T22:46:39.304574Z","iopub.status.idle":"2022-02-19T22:46:39.466774Z","shell.execute_reply.started":"2022-02-19T22:46:39.304543Z","shell.execute_reply":"2022-02-19T22:46:39.465684Z"},"_kg_hide-input":true,"trusted":true},"execution_count":null,"outputs":[]},{"cell_type":"code","source":"#Code by Taha07 https://www.kaggle.com/taha07/data-scientists-jobs-analysis-visualization/notebook\n\ncolor = plt.cm.Oranges(np.linspace(0,1,20))\ntaxonomy [\"genus\"].value_counts().sort_values(ascending=False).head(20).plot.pie(y=\"category_id\",colors=color,autopct=\"%0.1f%%\")\nplt.title(\"North America Flora Genus\")\nplt.axis(\"off\")\nplt.show()","metadata":{"_kg_hide-input":true,"execution":{"iopub.status.busy":"2022-02-19T22:46:51.416774Z","iopub.execute_input":"2022-02-19T22:46:51.417341Z","iopub.status.idle":"2022-02-19T22:46:51.721363Z","shell.execute_reply.started":"2022-02-19T22:46:51.417291Z","shell.execute_reply":"2022-02-19T22:46:51.720253Z"},"trusted":true},"execution_count":null,"outputs":[]},{"cell_type":"code","source":"ax = taxonomy['genus'].value_counts()[:20].plot.barh(figsize=(16, 8), color='purple')\nax.set_title('North America Flora Genus', size=18, color='red')\nax.set_ylabel('Genus', size=10)\nax.set_xlabel('Count', size=10);","metadata":{"execution":{"iopub.status.busy":"2022-02-19T22:47:01.214894Z","iopub.execute_input":"2022-02-19T22:47:01.215702Z","iopub.status.idle":"2022-02-19T22:47:01.556684Z","shell.execute_reply.started":"2022-02-19T22:47:01.215653Z","shell.execute_reply":"2022-02-19T22:47:01.555728Z"},"_kg_hide-input":true,"trusted":true},"execution_count":null,"outputs":[]},{"cell_type":"markdown","source":"Plants Biodiversity
\n\n\"Biodiversity is essential for ecosystem function yet is being lost at an unprecedented rate. This threat to ecosystem function has downstream economic and cultural consequences that affect human health and well-being.\"\n\n\"Plants are the foundation of ecosystem architecture and agriculture, and as such, changes in plant species diversity strongly influence processes such as biomass production, decomposition, and nutrient cycling. Plant diversity is therefore critical for diversity on other trophic levels.\"","metadata":{}},{"cell_type":"code","source":"#Code by Kohei-mu https://www.kaggle.com/koheimuramatsu/industrial-accident-causal-analysis/notebook\n\n#Fixed by Des https://www.kaggle.com/desalegngeb/bokeh-visualization-library-guide-for-beginners\n\nspecies_cnt = np.round((taxonomy['species'].value_counts(normalize=True) *100).head(10))\nhv.Bars(species_cnt[::-1]).opts(title=\"North America Flora Species\", color=\"blue\", xlabel=\"Flora Species\", ylabel=\"Percentage\", xformatter='%d%%')\\\n .opts(opts.Bars(width=600, height=600,tools=['hover'],show_grid=True,invert_axes=True))","metadata":{"execution":{"iopub.status.busy":"2022-02-19T22:49:31.181192Z","iopub.execute_input":"2022-02-19T22:49:31.181512Z","iopub.status.idle":"2022-02-19T22:49:31.347408Z","shell.execute_reply.started":"2022-02-19T22:49:31.181479Z","shell.execute_reply":"2022-02-19T22:49:31.34674Z"},"_kg_hide-input":true,"trusted":true},"execution_count":null,"outputs":[]},{"cell_type":"code","source":"#Code by Taha07 https://www.kaggle.com/taha07/data-scientists-jobs-analysis-visualization/notebook\n\ncolor = plt.cm.winter(np.linspace(0,1,20))\ntaxonomy [\"species\"].value_counts().sort_values(ascending=False).head(20).plot.pie(y=\"category_id\",colors=color,autopct=\"%0.1f%%\")\nplt.title(\"North America Flora Species\")\nplt.axis(\"off\");","metadata":{"_kg_hide-input":true,"execution":{"iopub.status.busy":"2022-02-19T22:49:41.512417Z","iopub.execute_input":"2022-02-19T22:49:41.513321Z","iopub.status.idle":"2022-02-19T22:49:41.846411Z","shell.execute_reply.started":"2022-02-19T22:49:41.513277Z","shell.execute_reply":"2022-02-19T22:49:41.845364Z"},"trusted":true},"execution_count":null,"outputs":[]},{"cell_type":"code","source":"ax = taxonomy['species'].value_counts()[:20].plot.barh(figsize=(16, 8), color='yellow')\nax.set_title('North America Flora Species', size=18, color='red')\nax.set_ylabel('Species', size=10)\nax.set_xlabel('Count', size=10);","metadata":{"_kg_hide-input":true,"execution":{"iopub.status.busy":"2022-02-19T22:50:25.127964Z","iopub.execute_input":"2022-02-19T22:50:25.12827Z","iopub.status.idle":"2022-02-19T22:50:25.502497Z","shell.execute_reply.started":"2022-02-19T22:50:25.128233Z","shell.execute_reply":"2022-02-19T22:50:25.501453Z"},"trusted":true},"execution_count":null,"outputs":[]},{"cell_type":"code","source":"#Code by Taha07 https://www.kaggle.com/taha07/data-scientists-jobs-analysis-visualization/notebook\n\n#Code by Taha07 https://www.kaggle.com/taha07/data-scientists-jobs-analysis-visualization/notebook\n\ncolor = plt.cm.winter(np.linspace(0,1,20))\ntaxonomy [\"species\"].value_counts().sort_values(ascending=False).head(20).plot.pie(y=\"category_id\",colors=color,autopct=\"%0.1f%%\")\nplt.title(\"\")\nplt.axis(\"off\");","metadata":{"_kg_hide-input":true,"execution":{"iopub.status.busy":"2022-02-19T22:52:10.550575Z","iopub.execute_input":"2022-02-19T22:52:10.550876Z","iopub.status.idle":"2022-02-19T22:52:10.912776Z","shell.execute_reply.started":"2022-02-19T22:52:10.550835Z","shell.execute_reply":"2022-02-19T22:52:10.911671Z"},"trusted":true},"execution_count":null,"outputs":[]},{"cell_type":"code","source":"#Code by Kohei-mu https://www.kaggle.com/koheimuramatsu/industrial-accident-causal-analysis/notebook\n\n#Fixed by Des https://www.kaggle.com/desalegngeb/bokeh-visualization-library-guide-for-beginners\n\nfamily_cnt = np.round((taxonomy['family'].value_counts(normalize=True) *100).head(10))\nhv.Bars(family_cnt[::-1]).opts(title=\"North America Flora Families\", color=\"purple\", xlabel=\"Flora Families\", ylabel=\"Percentage\", xformatter='%d%%')\\\n .opts(opts.Bars(width=600, height=600,tools=['hover'],show_grid=True,invert_axes=True))","metadata":{"execution":{"iopub.status.busy":"2022-02-19T22:52:58.920615Z","iopub.execute_input":"2022-02-19T22:52:58.920889Z","iopub.status.idle":"2022-02-19T22:52:59.080314Z","shell.execute_reply.started":"2022-02-19T22:52:58.92086Z","shell.execute_reply":"2022-02-19T22:52:59.07943Z"},"_kg_hide-input":true,"trusted":true},"execution_count":null,"outputs":[]},{"cell_type":"markdown","source":"That's it, no predictions to that Taxonomy Kaggle Notbook.","metadata":{}},{"cell_type":"markdown","source":"#Acknowledgements:\n\nVentakumar R https://www.kaggle.com/venkatkumar001/hfp-2-eda-tensorflow/notebook\n\nPooja Jain https://www.kaggle.com/jainpooja/av-guided-hackathon-predict-youtube-likes/notebook\n\nTaha07 https://www.kaggle.com/taha07/data-scientists-jobs-analysis-visualization/notebook\n\nKohei-mu https://www.kaggle.com/koheimuramatsu/industrial-accident-causal-analysis/notebook\n\nDes https://www.kaggle.com/desalegngeb/bokeh-visualization-library-guide-for-beginners\n\n","metadata":{}}]}