\n

I can’t believe I secured 4th place in this competition. This is my first time participating in a Kaggle competition, and I’m so lucky that I managed to place so well. I’m grateful for all the support from the community and the amazing resources available on Kaggle. I’m excited to continue learning and taking on new challenges in the future!
\nWe focused heavily on data preprocessing. First we drop all rows with ambigious sii. Then after reviewing several notebooks and conducting our own research, we selected key features to handle missing values. For less important columns, we chose not to fill missing values as we found that doing so worsened the results, likely due to lack and unreliable data. For important columns, missing values were filled using a submodel with inputs from other reliable columns (such as demographic data or pre-filled columns). This sub-model could be linear regression, logistic regression, or KNN, depending on the case. We also added weights to certain columns like CGAS-CGAS_Score and SDS-SDS_Total_Raw (which will be explained later)
\nWe proceeded to feature engineering, where we combined features that we believed had clear relationships, such as age and BMI, or SDS and CGAS…
\nFor our final model, we employed a stacking approach combining three high performing models: CatBoost, LightGBM, and XGBoost. We train our models in 5 folds of data, and then optimized sii decision rounding threshold
\nList of features we thought were the most important:
\nHere are how we fill the missing values for these columns:
\nAge, Sex, Demos-Season ----- knn -----> Physical Weight, Height
\nWeight, Height ----------> BMI
\nBMI, Weight ----- Linear regression -----> Waist circumstances
\nAge, SDS-Season ----- knn -----> SDS-Total-Raw
\nAge, Sex, SDS-Total-Raw, Internet-Season ----- Logistic Regression -----> Internet hours use
💡Note: We didn't fill CGAS score because we can't find a strong enough relationship between it and any other columns beside Age, but it's still an important feature
\nFor other columns, include the time series columns, we will remove the outliers and incorrect data, or just completely removed columns that were deemed unhelpful
\nAfter observing:
\nThis might indicate that a CGAS score of 80 and an SDS score of 35 could serve as effective thresholds for predicting who has severe problematic internet use (PIU) and who does not.
\nTherefore, we decided to assign weights to these two columns. The weights are calculated using a sigmoid function. The characteristic of the sigmoid function is that the closer the values are to the threshold, the steeper the curve becomes, allowing for clearer differentiation.
\nFor example, the weight for the CGAS score is calculated as follows:
\n$$
\n\\text{CGAS_Weight}(cgas, a, b) = \\frac{1}{1 + e^{-a \\cdot (cgas - b)}}
\n$$
The plot:
\n
When the CGAS score is closer to 80, the curve becomes steeper. This means the weight for the CGAS score changes more, enhancing its ability to aid in classification.
\nWe then multiply the CGAS score by its weight to create a new feature, Weighted_CGAS_Score, which will be used in the feature engineering process.
\nThe same technique is applied to the SDS score, resulting in Weighted_SDS_Score.
\nWe did not employ any particularly advanced techniques here, we just combine columns that we feel were related to each other. Important features are prioritized more.
\nTrain and validation score results for individuals and stacking model, calculated by quadratic cohen kappa score:
\n| \n | XGB | \nLGB | \nCatBoost | \nEnsemble | \n
|---|---|---|---|---|
| Train | \n0.6429 | \n0.8066 | \n0.5472 | \n0.6138 | \n
| Validation | \n0.3846 | \n0.3909 | \n0.3857 | \n0.3912 | \n
Best EDA ever https://www.kaggle.com/code/antoninadolgorukova/cmi-piu-features-eda
\nTime series data EDA and threshold tuning methods from https://www.kaggle.com/code/ambrosm/piu-eda-which-makes-sense
Thank you for reading till the end
", "messages": [ { "id": "3078257", "postDate": "12/22/2024 03:09:41", "content": "I can’t believe I secured 4th place in this competition. This is my first time participating in a Kaggle competition, and I’m so lucky that I managed to place so well. I’m grateful for all the support from the community and the amazing resources available on Kaggle. I’m excited to continue learning and taking on new challenges in the future!
\nWe focused heavily on data preprocessing. First we drop all rows with ambigious sii. Then after reviewing several notebooks and conducting our own research, we selected key features to handle missing values. For less important columns, we chose not to fill missing values as we found that doing so worsened the results, likely due to lack and unreliable data. For important columns, missing values were filled using a submodel with inputs from other reliable columns (such as demographic data or pre-filled columns). This sub-model could be linear regression, logistic regression, or KNN, depending on the case. We also added weights to certain columns like CGAS-CGAS_Score and SDS-SDS_Total_Raw (which will be explained later)
\nWe proceeded to feature engineering, where we combined features that we believed had clear relationships, such as age and BMI, or SDS and CGAS…
\nFor our final model, we employed a stacking approach combining three high performing models: CatBoost, LightGBM, and XGBoost. We train our models in 5 folds of data, and then optimized sii decision rounding threshold
\nList of features we thought were the most important:
\nHere are how we fill the missing values for these columns:
\nAge, Sex, Demos-Season ----- knn -----> Physical Weight, Height
\nWeight, Height ----------> BMI
\nBMI, Weight ----- Linear regression -----> Waist circumstances
\nAge, SDS-Season ----- knn -----> SDS-Total-Raw
\nAge, Sex, SDS-Total-Raw, Internet-Season ----- Logistic Regression -----> Internet hours use
💡Note: We didn't fill CGAS score because we can't find a strong enough relationship between it and any other columns beside Age, but it's still an important feature
\nFor other columns, include the time series columns, we will remove the outliers and incorrect data, or just completely removed columns that were deemed unhelpful
\nAfter observing:
\nThis might indicate that a CGAS score of 80 and an SDS score of 35 could serve as effective thresholds for predicting who has severe problematic internet use (PIU) and who does not.
\nTherefore, we decided to assign weights to these two columns. The weights are calculated using a sigmoid function. The characteristic of the sigmoid function is that the closer the values are to the threshold, the steeper the curve becomes, allowing for clearer differentiation.
\nFor example, the weight for the CGAS score is calculated as follows:
\n$$
\n\\text{CGAS_Weight}(cgas, a, b) = \\frac{1}{1 + e^{-a \\cdot (cgas - b)}}
\n$$
The plot:
\n
When the CGAS score is closer to 80, the curve becomes steeper. This means the weight for the CGAS score changes more, enhancing its ability to aid in classification.
\nWe then multiply the CGAS score by its weight to create a new feature, Weighted_CGAS_Score, which will be used in the feature engineering process.
\nThe same technique is applied to the SDS score, resulting in Weighted_SDS_Score.
\nWe did not employ any particularly advanced techniques here, we just combine columns that we feel were related to each other. Important features are prioritized more.
\nTrain and validation score results for individuals and stacking model, calculated by quadratic cohen kappa score:
\n| \n | XGB | \nLGB | \nCatBoost | \nEnsemble | \n
|---|---|---|---|---|
| Train | \n0.6429 | \n0.8066 | \n0.5472 | \n0.6138 | \n
| Validation | \n0.3846 | \n0.3909 | \n0.3857 | \n0.3912 | \n
Best EDA ever https://www.kaggle.com/code/antoninadolgorukova/cmi-piu-features-eda
\nTime series data EDA and threshold tuning methods from https://www.kaggle.com/code/ambrosm/piu-eda-which-makes-sense
Thank you for reading till the end
", "rawMarkdown": "I can’t believe I secured 4th place in this competition. This is my first time participating in a Kaggle competition, and I’m so lucky that I managed to place so well. I’m grateful for all the support from the community and the amazing resources available on Kaggle. I’m excited to continue learning and taking on new challenges in the future!\n\n## Overview\n\nWe focused heavily on data preprocessing. First we drop all rows with ambigious sii. Then after reviewing several notebooks and conducting our own research, we selected key features to handle missing values. For less important columns, we chose not to fill missing values as we found that doing so worsened the results, likely due to lack and unreliable data. For important columns, missing values were filled using a submodel with inputs from other reliable columns (such as demographic data or pre-filled columns). This sub-model could be linear regression, logistic regression, or KNN, depending on the case. We also added weights to certain columns like CGAS-CGAS_Score and SDS-SDS_Total_Raw (which will be explained later)\n\nWe proceeded to feature engineering, where we combined features that we believed had clear relationships, such as age and BMI, or SDS and CGAS…\n\nFor our final model, we employed a stacking approach combining three high performing models: CatBoost, LightGBM, and XGBoost. We train our models in 5 folds of data, and then optimized sii decision rounding threshold\n\n## Details\n\n### Most important features\nList of features we thought were the most important:\n- Age\n- Physical columns (BMI, weight, height, waist circumstances)\n- Internet use hours\n- SDS (raw) \n- CGAS score\n\n### Handle missing values\nHere are how we fill the missing values for these columns:\nAge, Sex, Demos-Season ----- knn -----> Physical Weight, Height\nWeight, Height ----------> BMI\nBMI, Weight ----- Linear regression -----> Waist circumstances\nAge, SDS-Season ----- knn -----> SDS-Total-Raw\nAge, Sex, SDS-Total-Raw, Internet-Season ----- Logistic Regression -----> Internet hours use\n\n💡Note: We didn't fill CGAS score because we can't find a strong enough relationship between it and any other columns beside Age, but it's still an important feature\n\nFor other columns, include the time series columns, we will remove the outliers and incorrect data, or just completely removed columns that were deemed unhelpful\n\n### Add some weights for CGAS score column and SDS score raw column\nAfter observing:\n- There are no participants with an SII score of 3 who have a CGAS score > 80.\n- There are no participants with an SII score of 3 who have an SDS score < 35.\n\nThis might indicate that a CGAS score of 80 and an SDS score of 35 could serve as effective thresholds for predicting who has severe problematic internet use (PIU) and who does not.\n\nTherefore, we decided to assign weights to these two columns. The weights are calculated using a sigmoid function. The characteristic of the sigmoid function is that the closer the values are to the threshold, the steeper the curve becomes, allowing for clearer differentiation.\n\nFor example, the weight for the CGAS score is calculated as follows:\n$$\n\\text{CGAS_Weight}(cgas, a, b) = \\frac{1}{1 + e^{-a \\cdot (cgas - b)}}\n$$\n\nThe plot:\n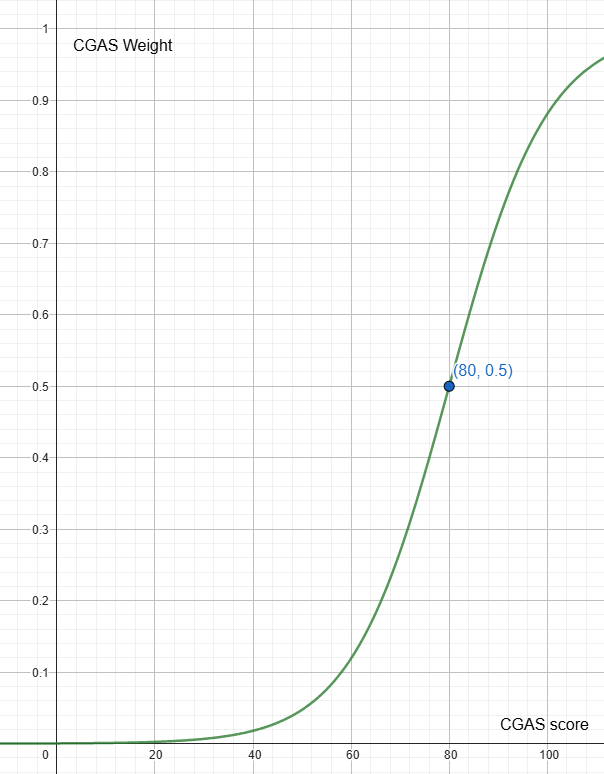\n\nWhen the CGAS score is closer to 80, the curve becomes steeper. This means the weight for the CGAS score changes more, enhancing its ability to aid in classification.\n\nWe then multiply the CGAS score by its weight to create a new feature, Weighted_CGAS_Score, which will be used in the feature engineering process.\n\nThe same technique is applied to the SDS score, resulting in Weighted_SDS_Score.\n\n### Feature Engineering\nWe did not employ any particularly advanced techniques here, we just combine columns that we feel were related to each other. Important features are prioritized more.\n\n### Modeling and training\nTrain and validation score results for individuals and stacking model, calculated by quadratic cohen kappa score:\n|| XGB | LGB | CatBoost | Ensemble |\n| --- | --- | --- | --- | --- |\n| Train | 0.6429 | 0.8066 | 0.5472 | 0.6138 |\n| Validation | 0.3846 | 0.3909 | 0.3857 | 0.3912 |\n\n### What were tried but didn't work\n- We added Tabnet for ensemble model but it never did great\n- We tried to predict the PCIAT-PCIAT_Total column at first and then map it to SII but it also yielded poor results. Our performance improved when we switched to predicting SII directly and applied a threshold tuning technique to optimize the rounding threshold.\n\n## Sources\nBest EDA ever https://www.kaggle.com/code/antoninadolgorukova/cmi-piu-features-eda\nTime series data EDA and threshold tuning methods from https://www.kaggle.com/code/ambrosm/piu-eda-which-makes-sense\n\nThank you for reading till the end", "votes": null }, { "id": "3078917", "postDate": "12/23/2024 02:22:12", "content": "Congratulations. The method of handling missing values is a novel and effective approach.
", "rawMarkdown": "Congratulations. The method of handling missing values is a novel and effective approach.", "votes": null }, { "id": "3078920", "postDate": "12/23/2024 02:40:45", "content": "Thank you so much 🙏
", "rawMarkdown": "Thank you so much 🙏", "votes": null }, { "id": "3078974", "postDate": "12/23/2024 04:44:57", "content": "Thanks for sharing. Learned a lot from your approach.
", "rawMarkdown": "Thanks for sharing. Learned a lot from your approach.", "votes": null }, { "id": "3079053", "postDate": "12/23/2024 07:04:37", "content": "Thank you, I’m glad it helped too 😁
", "rawMarkdown": "Thank you, I’m glad it helped too 😁", "votes": null }, { "id": "3079107", "postDate": "12/23/2024 08:40:03", "content": "What metrics do you use to determine different filling methods for different columns? Kl divergence?
", "rawMarkdown": "What metrics do you use to determine different filling methods for different columns? Kl divergence?", "votes": null }, { "id": "3079423", "postDate": "12/23/2024 15:53:40", "content": "We didn't use complex metrics. Instead, we chose linear regression for waist circumstances due to its linear relationship with BMI and weight, logistic regression for internet hours use as it's a classification task, and just pick KNN for the remaining cases
", "rawMarkdown": "We didn't use complex metrics. Instead, we chose linear regression for waist circumstances due to its linear relationship with BMI and weight, logistic regression for internet hours use as it's a classification task, and just pick KNN for the remaining cases", "votes": null }, { "id": "3079458", "postDate": "12/23/2024 17:15:48", "content": "Great choice to use linear regression and logistic regression to deal with missing values. Congratulations
", "rawMarkdown": "Great choice to use linear regression and logistic regression to deal with missing values. Congratulations", "votes": null }, { "id": "3079470", "postDate": "12/23/2024 17:35:47", "content": "Thank you! Actually, I chose linear regression and logistic regression because I’ve just started learning these and didn’t know much about other complex methods. I went with the simplest approach that seemed to fit the problem.
", "rawMarkdown": "Thank you! Actually, I chose linear regression and logistic regression because I’ve just started learning these and didn’t know much about other complex methods. I went with the simplest approach that seemed to fit the problem.", "votes": null }, { "id": "3079790", "postDate": "12/24/2024 06:15:23", "content": "good writeup! Looking forward to learn from you. Congratulation!
", "rawMarkdown": "good writeup! Looking forward to learn from you. Congratulation!", "votes": null }, { "id": "3080113", "postDate": "12/24/2024 16:51:59", "content": "Thank you very much 🙏🏼
", "rawMarkdown": "Thank you very much 🙏🏼", "votes": null }, { "id": "3086697", "postDate": "01/02/2025 15:45:59", "content": "Congratulation! Can I have your contact. Because I want to ask you something.
\nhttps://www.facebook.com/dtleez/
\nPleas add me as a friend on facebook
Sure, I have sent you a friend request under the name Quang Dũng
", "rawMarkdown": "Sure, I have sent you a friend request under the name Quang Dũng", "votes": null }, { "id": "3115854", "postDate": "02/05/2025 10:23:59", "content": "Nice competition about today's high internet usage
", "rawMarkdown": "Nice competition about today's high internet usage", "votes": null } ], "comments": [ { "id": 3078917, "author_name": "jiaoyouzhang", "author_url": "", "post_date": "12/23/2024 02:22:12", "content": "Congratulations. The method of handling missing values is a novel and effective approach.
", "votes": null, "replies": [ { "id": 3078920, "author_name": "dungquang8229", "author_url": "", "post_date": "12/23/2024 02:40:45", "content": "Thank you so much 🙏
", "votes": null, "replies": [] } ] }, { "id": 3078974, "author_name": "arthurt800", "author_url": "", "post_date": "12/23/2024 04:44:57", "content": "Thanks for sharing. Learned a lot from your approach.
", "votes": null, "replies": [ { "id": 3079053, "author_name": "dungquang8229", "author_url": "", "post_date": "12/23/2024 07:04:37", "content": "Thank you, I’m glad it helped too 😁
", "votes": null, "replies": [] } ] }, { "id": 3079107, "author_name": "ruichardliu", "author_url": "", "post_date": "12/23/2024 08:40:03", "content": "What metrics do you use to determine different filling methods for different columns? Kl divergence?
", "votes": null, "replies": [ { "id": 3079423, "author_name": "dungquang8229", "author_url": "", "post_date": "12/23/2024 15:53:40", "content": "We didn't use complex metrics. Instead, we chose linear regression for waist circumstances due to its linear relationship with BMI and weight, logistic regression for internet hours use as it's a classification task, and just pick KNN for the remaining cases
", "votes": null, "replies": [ { "id": 3079458, "author_name": "ruichardliu", "author_url": "", "post_date": "12/23/2024 17:15:48", "content": "Great choice to use linear regression and logistic regression to deal with missing values. Congratulations
", "votes": null, "replies": [ { "id": 3079470, "author_name": "dungquang8229", "author_url": "", "post_date": "12/23/2024 17:35:47", "content": "Thank you! Actually, I chose linear regression and logistic regression because I’ve just started learning these and didn’t know much about other complex methods. I went with the simplest approach that seemed to fit the problem.
", "votes": null, "replies": [] } ] } ] } ] }, { "id": 3079790, "author_name": "tanishkpatil", "author_url": "", "post_date": "12/24/2024 06:15:23", "content": "good writeup! Looking forward to learn from you. Congratulation!
", "votes": null, "replies": [ { "id": 3080113, "author_name": "dungquang8229", "author_url": "", "post_date": "12/24/2024 16:51:59", "content": "Thank you very much 🙏🏼
", "votes": null, "replies": [] } ] }, { "id": 3086697, "author_name": "dtleez", "author_url": "", "post_date": "01/02/2025 15:45:59", "content": "Congratulation! Can I have your contact. Because I want to ask you something.
\nhttps://www.facebook.com/dtleez/
\nPleas add me as a friend on facebook
Sure, I have sent you a friend request under the name Quang Dũng
", "votes": null, "replies": [] } ] }, { "id": 3115854, "author_name": "", "author_url": "", "post_date": "02/05/2025 10:23:59", "content": "Nice competition about today's high internet usage
", "votes": null, "replies": [] } ], "raw_markdown_by_id": { "3078257": "I can’t believe I secured 4th place in this competition. This is my first time participating in a Kaggle competition, and I’m so lucky that I managed to place so well. I’m grateful for all the support from the community and the amazing resources available on Kaggle. I’m excited to continue learning and taking on new challenges in the future!\n\n## Overview\n\nWe focused heavily on data preprocessing. First we drop all rows with ambigious sii. Then after reviewing several notebooks and conducting our own research, we selected key features to handle missing values. For less important columns, we chose not to fill missing values as we found that doing so worsened the results, likely due to lack and unreliable data. For important columns, missing values were filled using a submodel with inputs from other reliable columns (such as demographic data or pre-filled columns). This sub-model could be linear regression, logistic regression, or KNN, depending on the case. We also added weights to certain columns like CGAS-CGAS_Score and SDS-SDS_Total_Raw (which will be explained later)\n\nWe proceeded to feature engineering, where we combined features that we believed had clear relationships, such as age and BMI, or SDS and CGAS…\n\nFor our final model, we employed a stacking approach combining three high performing models: CatBoost, LightGBM, and XGBoost. We train our models in 5 folds of data, and then optimized sii decision rounding threshold\n\n## Details\n\n### Most important features\nList of features we thought were the most important:\n- Age\n- Physical columns (BMI, weight, height, waist circumstances)\n- Internet use hours\n- SDS (raw) \n- CGAS score\n\n### Handle missing values\nHere are how we fill the missing values for these columns:\nAge, Sex, Demos-Season ----- knn -----> Physical Weight, Height\nWeight, Height ----------> BMI\nBMI, Weight ----- Linear regression -----> Waist circumstances\nAge, SDS-Season ----- knn -----> SDS-Total-Raw\nAge, Sex, SDS-Total-Raw, Internet-Season ----- Logistic Regression -----> Internet hours use\n\n💡Note: We didn't fill CGAS score because we can't find a strong enough relationship between it and any other columns beside Age, but it's still an important feature\n\nFor other columns, include the time series columns, we will remove the outliers and incorrect data, or just completely removed columns that were deemed unhelpful\n\n### Add some weights for CGAS score column and SDS score raw column\nAfter observing:\n- There are no participants with an SII score of 3 who have a CGAS score > 80.\n- There are no participants with an SII score of 3 who have an SDS score < 35.\n\nThis might indicate that a CGAS score of 80 and an SDS score of 35 could serve as effective thresholds for predicting who has severe problematic internet use (PIU) and who does not.\n\nTherefore, we decided to assign weights to these two columns. The weights are calculated using a sigmoid function. The characteristic of the sigmoid function is that the closer the values are to the threshold, the steeper the curve becomes, allowing for clearer differentiation.\n\nFor example, the weight for the CGAS score is calculated as follows:\n$$\n\\text{CGAS_Weight}(cgas, a, b) = \\frac{1}{1 + e^{-a \\cdot (cgas - b)}}\n$$\n\nThe plot:\n\n\nWhen the CGAS score is closer to 80, the curve becomes steeper. This means the weight for the CGAS score changes more, enhancing its ability to aid in classification.\n\nWe then multiply the CGAS score by its weight to create a new feature, Weighted_CGAS_Score, which will be used in the feature engineering process.\n\nThe same technique is applied to the SDS score, resulting in Weighted_SDS_Score.\n\n### Feature Engineering\nWe did not employ any particularly advanced techniques here, we just combine columns that we feel were related to each other. Important features are prioritized more.\n\n### Modeling and training\nTrain and validation score results for individuals and stacking model, calculated by quadratic cohen kappa score:\n|| XGB | LGB | CatBoost | Ensemble |\n| --- | --- | --- | --- | --- |\n| Train | 0.6429 | 0.8066 | 0.5472 | 0.6138 |\n| Validation | 0.3846 | 0.3909 | 0.3857 | 0.3912 |\n\n### What were tried but didn't work\n- We added Tabnet for ensemble model but it never did great\n- We tried to predict the PCIAT-PCIAT_Total column at first and then map it to SII but it also yielded poor results. Our performance improved when we switched to predicting SII directly and applied a threshold tuning technique to optimize the rounding threshold.\n\n## Sources\nBest EDA ever https://www.kaggle.com/code/antoninadolgorukova/cmi-piu-features-eda\nTime series data EDA and threshold tuning methods from https://www.kaggle.com/code/ambrosm/piu-eda-which-makes-sense\n\nThank you for reading till the end", "3078917": "Congratulations. The method of handling missing values is a novel and effective approach.", "3078920": "Thank you so much 🙏", "3078974": "Thanks for sharing. Learned a lot from your approach.", "3079053": "Thank you, I’m glad it helped too 😁", "3079107": "What metrics do you use to determine different filling methods for different columns? Kl divergence?", "3079423": "We didn't use complex metrics. Instead, we chose linear regression for waist circumstances due to its linear relationship with BMI and weight, logistic regression for internet hours use as it's a classification task, and just pick KNN for the remaining cases", "3079458": "Great choice to use linear regression and logistic regression to deal with missing values. Congratulations", "3079470": "Thank you! Actually, I chose linear regression and logistic regression because I’ve just started learning these and didn’t know much about other complex methods. I went with the simplest approach that seemed to fit the problem.", "3079790": "good writeup! Looking forward to learn from you. Congratulation!", "3080113": "Thank you very much 🙏🏼", "3086697": "Congratulation! Can I have your contact. Because I want to ask you something. \nhttps://www.facebook.com/dtleez/\nPleas add me as a friend on facebook", "3088082": "Sure, I have sent you a friend request under the name Quang Dũng", "3115854": "Nice competition about today's high internet usage" }, "source": "meta" }