
this is my approach for this competition:
\n
1- For Time Series:
\nTo make some useful features from the time series, I used clustering. I picked 6 parquet files (2 most variant files from each class), combined them, and fit 15 clusters using the KMeans algorithm. then i used this fitted model to extract cluster from other parquets
\nI assumed each cluster could represent a specific movement in the parquet data. Then, I averaged each cluster's values over the time duration and used that average as a feature for each user. So, in the end, I had 15 features per user, which represented the average of some kind of activity during the time the user wore the watch.
\nI was late in the competition and didn’t have enough time to clean the data or extract more useful features from the time series. I believe there was a lot of room to extract much better features from it.
2- Choosing the Right Target:
\nAfter some initial submissions, I found that using threshold optimization led to overfitting and inconsistent results. So, I ignored optimization and used PCIAT-PCIAT_Total as the target labels, and applied fixed thresholds [31, 50, 80]. Since the exact values between these thresholds were less important than their relative position to the thresholds for the final prediction, I binned the PCIAT-PCIAT_Total into 10 bins and adjusted the thresholds accordingly.
3 - For Unlabeled Data:
\nI used pseudo-labeling. I trained three GBDT models (CatBoost, LGBM, XGB), a Lasso regression model, and a neural network (256-128-64 architecture). Then I ensembled these models to predict labels for the unlabeled data. These new labels were then used to train my final models.
4-For Final Prediction:
\nFor the final prediction, I used the same four models I had used in pseudo-labeling, trained on combination of original and pseudo labels. I trained the models on the entire dataset and validated only on the original labels. This approach gave me the following results for my winning submission (I didn’t use time series for this prediction):

Then, I trained GBDT models on the whole dataset (tabular data + time series features). And used all these models for final ensemble
\nCombining these models gave me a CV of 4.6 and a private LB of 4.81, which put me in second place. However, since QWK is a noisy metric, I tried adding some other models (logistic regression and decision tree regression) with lower CV scores. This improved my final CV and public LB slightly, but it dropped my private score from 4.81 to 4.77. I couldn’t blame for this because at the end the CV and LB and also the consistency between these two are the only metrics to choose final submission.
\nspecial Thanks to organizers and Kaggle and all participants who shared their knowledge. Best of luck in the next competition, and Happy New Year!
", "messages": [ { "id": "3077317", "postDate": "12/20/2024 19:31:27", "content": "this is my approach for this competition:
\n
1- For Time Series:
\nTo make some useful features from the time series, I used clustering. I picked 6 parquet files (2 most variant files from each class), combined them, and fit 15 clusters using the KMeans algorithm. then i used this fitted model to extract cluster from other parquets
\nI assumed each cluster could represent a specific movement in the parquet data. Then, I averaged each cluster's values over the time duration and used that average as a feature for each user. So, in the end, I had 15 features per user, which represented the average of some kind of activity during the time the user wore the watch.
\nI was late in the competition and didn’t have enough time to clean the data or extract more useful features from the time series. I believe there was a lot of room to extract much better features from it.
2- Choosing the Right Target:
\nAfter some initial submissions, I found that using threshold optimization led to overfitting and inconsistent results. So, I ignored optimization and used PCIAT-PCIAT_Total as the target labels, and applied fixed thresholds [31, 50, 80]. Since the exact values between these thresholds were less important than their relative position to the thresholds for the final prediction, I binned the PCIAT-PCIAT_Total into 10 bins and adjusted the thresholds accordingly.
3 - For Unlabeled Data:
\nI used pseudo-labeling. I trained three GBDT models (CatBoost, LGBM, XGB), a Lasso regression model, and a neural network (256-128-64 architecture). Then I ensembled these models to predict labels for the unlabeled data. These new labels were then used to train my final models.
4-For Final Prediction:
\nFor the final prediction, I used the same four models I had used in pseudo-labeling, trained on combination of original and pseudo labels. I trained the models on the entire dataset and validated only on the original labels. This approach gave me the following results for my winning submission (I didn’t use time series for this prediction):
Then, I trained GBDT models on the whole dataset (tabular data + time series features). And used all these models for final ensemble
\nCombining these models gave me a CV of 4.6 and a private LB of 4.81, which put me in second place. However, since QWK is a noisy metric, I tried adding some other models (logistic regression and decision tree regression) with lower CV scores. This improved my final CV and public LB slightly, but it dropped my private score from 4.81 to 4.77. I couldn’t blame for this because at the end the CV and LB and also the consistency between these two are the only metrics to choose final submission.
\nspecial Thanks to organizers and Kaggle and all participants who shared their knowledge. Best of luck in the next competition, and Happy New Year!
", "rawMarkdown": "this is my approach for this competition:\n\n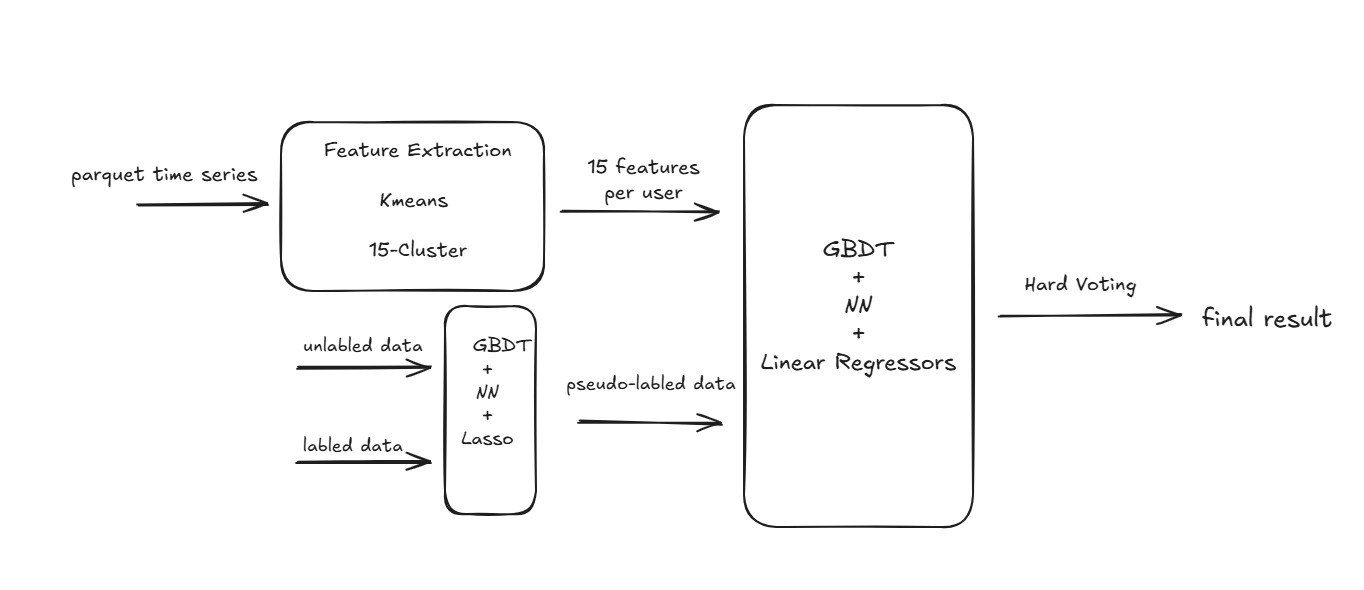\n\n\n1- **For Time Series:**\nTo make some useful features from the time series, I used clustering. I picked 6 parquet files (2 most variant files from each class), combined them, and fit 15 clusters using the KMeans algorithm. then i used this fitted model to extract cluster from other parquets\nI assumed each cluster could represent a specific movement in the parquet data. Then, I averaged each cluster's values over the time duration and used that average as a feature for each user. So, in the end, I had 15 features per user, which represented the average of some kind of activity during the time the user wore the watch.\nI was late in the competition and didn’t have enough time to clean the data or extract more useful features from the time series. I believe there was a lot of room to extract much better features from it.\n\n2- **Choosing the Right Target:**\nAfter some initial submissions, I found that using threshold optimization led to overfitting and inconsistent results. So, I ignored optimization and used PCIAT-PCIAT_Total as the target labels, and applied fixed thresholds [31, 50, 80]. Since the exact values between these thresholds were less important than their relative position to the thresholds for the final prediction, I binned the PCIAT-PCIAT_Total into 10 bins and adjusted the thresholds accordingly.\n\n3 - **For Unlabeled Data:**\nI used pseudo-labeling. I trained three GBDT models (CatBoost, LGBM, XGB), a Lasso regression model, and a neural network (256-128-64 architecture). Then I ensembled these models to predict labels for the unlabeled data. These new labels were then used to train my final models.\n\n4-**For Final Prediction:**\nFor the final prediction, I used the same four models I had used in pseudo-labeling, trained on combination of original and pseudo labels. I trained the models on the entire dataset and validated only on the original labels. This approach gave me the following results for my winning submission (I didn’t use time series for this prediction):\n\n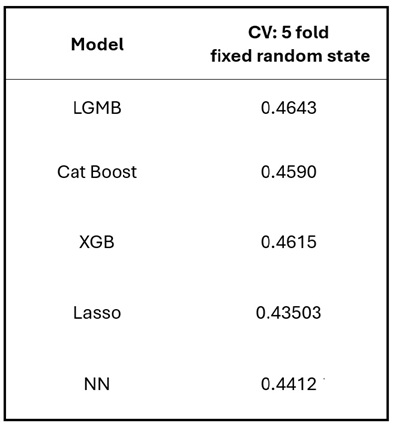\n\nThen, I trained GBDT models on the whole dataset (tabular data + time series features). And used all these models for final ensemble \n\nCombining these models gave me a CV of 4.6 and a private LB of 4.81, which put me in second place. However, since QWK is a noisy metric, I tried adding some other models (logistic regression and decision tree regression) with lower CV scores. This improved my final CV and public LB slightly, but it dropped my private score from 4.81 to 4.77. I couldn’t blame for this because at the end the CV and LB and also the consistency between these two are the only metrics to choose final submission. \n\nspecial Thanks to organizers and Kaggle and all participants who shared their knowledge. Best of luck in the next competition, and Happy New Year!", "votes": null }, { "id": "3077419", "postDate": "12/21/2024 00:05:05", "content": "Thanks for sharing. It's fab. And congratulations\"
\nMay I ask about point 3 (Unlabelled data)? Do you only fill features or do you fill PCIAT_total as well?
\nI spent quite a lot of time filling the unlabelled data but I only used LGBM. I somehow dropped mine since it didn't improve CV/LB.
\nYours sound robust.
thank you tom
\nI fill the NaN values in the features using KNN imputation for the entire dataset then I train some base models based on the available PCIAT_total and ensemble them using hill climbing. finally, I use the ensembled model to predict the missing PCIAT_total . throughout the process, I use rmse as the evaluation metric.
Congrats, Peyman! great execution and well-deserved success!
", "rawMarkdown": "Congrats, Peyman! great execution and well-deserved success!", "votes": null }, { "id": "3078464", "postDate": "12/22/2024 11:03:36", "content": "Great work and congratulations on the 5th place finish! 🎉
\nYour approach is really insightful, especially the use of clustering for time series feature extraction. It's impressive how you managed to simplify complex movements into representative features, even with limited time to refine.
\nI also appreciate the clarity in your reasoning for choosing the PCIAT-PCIAT_Total as the target and the fixed thresholds. It’s a practical way to address overfitting issues, and your binning strategy makes a lot of sense for stabilizing predictions.
\nPseudo-labeling combined with an ensemble of diverse models like GBDTs, Lasso, and a neural network was a smart way to leverage the unlabeled data effectively. The added robustness from this step clearly paid off!
\nThe trade-off between CV and LB scores is always tricky, especially with a noisy metric like QWK, but your experimentation with additional models to balance this was a great learning point.
\nThanks for sharing such a detailed breakdown, and best of luck in future competitions. Your strategy will definitely inspire others in tackling similar challenges! 👏
", "rawMarkdown": "Great work and congratulations on the 5th place finish! 🎉 \n\nYour approach is really insightful, especially the use of clustering for time series feature extraction. It's impressive how you managed to simplify complex movements into representative features, even with limited time to refine. \n\nI also appreciate the clarity in your reasoning for choosing the PCIAT-PCIAT_Total as the target and the fixed thresholds. It’s a practical way to address overfitting issues, and your binning strategy makes a lot of sense for stabilizing predictions. \n\nPseudo-labeling combined with an ensemble of diverse models like GBDTs, Lasso, and a neural network was a smart way to leverage the unlabeled data effectively. The added robustness from this step clearly paid off! \n\nThe trade-off between CV and LB scores is always tricky, especially with a noisy metric like QWK, but your experimentation with additional models to balance this was a great learning point. \n\nThanks for sharing such a detailed breakdown, and best of luck in future competitions. Your strategy will definitely inspire others in tackling similar challenges! 👏", "votes": null } ], "comments": [ { "id": 3077419, "author_name": "tomyuen", "author_url": "", "post_date": "12/21/2024 00:05:05", "content": "Thanks for sharing. It's fab. And congratulations\"
\nMay I ask about point 3 (Unlabelled data)? Do you only fill features or do you fill PCIAT_total as well?
\nI spent quite a lot of time filling the unlabelled data but I only used LGBM. I somehow dropped mine since it didn't improve CV/LB.
\nYours sound robust.
thank you tom
\nI fill the NaN values in the features using KNN imputation for the entire dataset then I train some base models based on the available PCIAT_total and ensemble them using hill climbing. finally, I use the ensembled model to predict the missing PCIAT_total . throughout the process, I use rmse as the evaluation metric.
Congrats, Peyman! great execution and well-deserved success!
", "votes": null, "replies": [] }, { "id": 3078464, "author_name": "sudhansu1234", "author_url": "", "post_date": "12/22/2024 11:03:36", "content": "Great work and congratulations on the 5th place finish! 🎉
\nYour approach is really insightful, especially the use of clustering for time series feature extraction. It's impressive how you managed to simplify complex movements into representative features, even with limited time to refine.
\nI also appreciate the clarity in your reasoning for choosing the PCIAT-PCIAT_Total as the target and the fixed thresholds. It’s a practical way to address overfitting issues, and your binning strategy makes a lot of sense for stabilizing predictions.
\nPseudo-labeling combined with an ensemble of diverse models like GBDTs, Lasso, and a neural network was a smart way to leverage the unlabeled data effectively. The added robustness from this step clearly paid off!
\nThe trade-off between CV and LB scores is always tricky, especially with a noisy metric like QWK, but your experimentation with additional models to balance this was a great learning point.
\nThanks for sharing such a detailed breakdown, and best of luck in future competitions. Your strategy will definitely inspire others in tackling similar challenges! 👏
", "votes": null, "replies": [] } ], "raw_markdown_by_id": { "3077317": "this is my approach for this competition:\n\n\n\n\n1- **For Time Series:**\nTo make some useful features from the time series, I used clustering. I picked 6 parquet files (2 most variant files from each class), combined them, and fit 15 clusters using the KMeans algorithm. then i used this fitted model to extract cluster from other parquets\nI assumed each cluster could represent a specific movement in the parquet data. Then, I averaged each cluster's values over the time duration and used that average as a feature for each user. So, in the end, I had 15 features per user, which represented the average of some kind of activity during the time the user wore the watch.\nI was late in the competition and didn’t have enough time to clean the data or extract more useful features from the time series. I believe there was a lot of room to extract much better features from it.\n\n2- **Choosing the Right Target:**\nAfter some initial submissions, I found that using threshold optimization led to overfitting and inconsistent results. So, I ignored optimization and used PCIAT-PCIAT_Total as the target labels, and applied fixed thresholds [31, 50, 80]. Since the exact values between these thresholds were less important than their relative position to the thresholds for the final prediction, I binned the PCIAT-PCIAT_Total into 10 bins and adjusted the thresholds accordingly.\n\n3 - **For Unlabeled Data:**\nI used pseudo-labeling. I trained three GBDT models (CatBoost, LGBM, XGB), a Lasso regression model, and a neural network (256-128-64 architecture). Then I ensembled these models to predict labels for the unlabeled data. These new labels were then used to train my final models.\n\n4-**For Final Prediction:**\nFor the final prediction, I used the same four models I had used in pseudo-labeling, trained on combination of original and pseudo labels. I trained the models on the entire dataset and validated only on the original labels. This approach gave me the following results for my winning submission (I didn’t use time series for this prediction):\n\n\n\nThen, I trained GBDT models on the whole dataset (tabular data + time series features). And used all these models for final ensemble \n\nCombining these models gave me a CV of 4.6 and a private LB of 4.81, which put me in second place. However, since QWK is a noisy metric, I tried adding some other models (logistic regression and decision tree regression) with lower CV scores. This improved my final CV and public LB slightly, but it dropped my private score from 4.81 to 4.77. I couldn’t blame for this because at the end the CV and LB and also the consistency between these two are the only metrics to choose final submission. \n\nspecial Thanks to organizers and Kaggle and all participants who shared their knowledge. Best of luck in the next competition, and Happy New Year!", "3077419": "Thanks for sharing. It's fab. And congratulations\"\nMay I ask about point 3 (Unlabelled data)? Do you only fill features or do you fill PCIAT_total as well?\nI spent quite a lot of time filling the unlabelled data but I only used LGBM. I somehow dropped mine since it didn't improve CV/LB.\nYours sound robust.", "3078056": "thank you tom\nI fill the NaN values in the features using KNN imputation for the entire dataset then I train some base models based on the available PCIAT_total and ensemble them using hill climbing. finally, I use the ensembled model to predict the missing PCIAT_total . throughout the process, I use rmse as the evaluation metric.", "3078448": "Congrats, Peyman! great execution and well-deserved success!", "3078464": "Great work and congratulations on the 5th place finish! 🎉 \n\nYour approach is really insightful, especially the use of clustering for time series feature extraction. It's impressive how you managed to simplify complex movements into representative features, even with limited time to refine. \n\nI also appreciate the clarity in your reasoning for choosing the PCIAT-PCIAT_Total as the target and the fixed thresholds. It’s a practical way to address overfitting issues, and your binning strategy makes a lot of sense for stabilizing predictions. \n\nPseudo-labeling combined with an ensemble of diverse models like GBDTs, Lasso, and a neural network was a smart way to leverage the unlabeled data effectively. The added robustness from this step clearly paid off! \n\nThe trade-off between CV and LB scores is always tricky, especially with a noisy metric like QWK, but your experimentation with additional models to balance this was a great learning point. \n\nThanks for sharing such a detailed breakdown, and best of luck in future competitions. Your strategy will definitely inspire others in tackling similar challenges! 👏" }, "source": "meta" }