\n

A big thanks to @andrewjdarley, BYU and Kaggle for hosting this competition! Also big shoutout to @brendanartley for generously sharing his external data with everyone!
\nHere’s a brief rundown of our solution — it’s straightforward and easy to implement:
\nOur model achieved a score of 0.86734 / 0.87656 on the public/private leaderboard, tying for 1st place. Kaggle resolves ties by submission time. Unfortunate for us — but very well deserved by Bartley. Congratulations!
\nWe are a team of colleagues (scientists and PhD students) affiliated with the Divisions of Medical Image Computing and Intelligent Medical Systems at the German Cancer Research Center, as well as Helmholtz Imaging. Our expertise lies in 3D image analysis — particularly in solving 3D segmentation problems and developing infrastructure to bring algorithms into the clinic. For 4 out of 5 of us, this was the first time seriously competing in a Kaggle competition, although we do have a track record in medical image segmentation challenges.
\nWe use the competition data (n=648), Bartleys external data (n=1287) as well as another 555 publicly available images (n=2490 in total).
\nBartleys data. We do not use Bartleys data as provided by him and instead redownload all images using a modified version of his provided CziiCollector. This was done for two reasons: a) his resizing strategy was different than our approach (see preprocessing), requiring us to start from raw tomograms, and b) he only used a fraction of the data that were downloaded (62/104 datasets and 1287/3395 tomograms).
Corrections. We use 5-fold cross-validation predictions from an earlier model to generate predictions for all official tomograms and Bartleys data (n=1935). We configure a very low detection threshold to reduce FN, at the cost of increased FP. We encode GT and prediction as instance segmentation maps with spheres representing motors and then manually inspect all tomograms for annotation errors using the napari data inspection tool. 213 tomograms were corrected, with the most common errors being:
\nWe emphasize that prior to this competition, none of our team members were intimately familiar with cryoET or the manifestation of bacterial morphology. Throughout the challenge, we trained our biological neural networks using the provided training data, ChatGPT, and Google Image Search. As such, while we made a genuine effort, our manual corrections may not be entirely accurate.
\nAdditional data. As outlined above, Bartley's dataset only covers a fraction of the tomograms that are downloaded by his CziiCollector. Note that the downloaded data is structured into datasets (n=104). We use one of our models (around 0.85/0.86 public) to predict all tomograms that were not already part of Bartley’s collection. We sample additional data using the following strategy:
Our additional data encompasses 555 additional tomograms. These 555 cases were then manually corrected using the same strategy as above. This brought the number of training cases up to 2490 from 1935.
\nWhen merging external data we emulate the intensity processing of the challenge to the external data by clipping to the 0.1 and 99.9th percentiles and converting to uint8, similar to how Bartley did it. This is only done to bring the data in line with the official data (and test set).
\nSince voxel spacing will not be available for the test set (which would have been preferable), we decided to resize all tomograms such that the longest edge is 512 pixels long.
\nnnU-Net automatically performs z-score normalization. Each image is converted to float32 and normalized individually by subtracting its mean and dividing by its standard deviation. As the original data is uint8, this step is potentially wasteful, but we did not have time to investigate other strategies and, frankly, did not see potential for improvement here.
We use nnU-Net’s ResEnc, which is essentially a UNet with a residual encoder and a lightweight convolutional decoder. We also experimented with nnU-Net’s standard UNet and, honestly, did not see a significant performance difference. Either one performed very well.
\nWe train all models from scratch. Initially, we performed 5-fold cross-validation to weed out bad design choices. Blob regression allows for multiple motor predictions per image and we developed an internal evaluation scheme that was compatible with arbitrary motor numbers, thus allowing us to use all images of the train data for internal validation. Later on we relied on the leaderboard to provide feedback as the gap we observed between internal performance and public score made us distrust internal results for final model optimization.
\nBlob regression is a standard approach for landmark detection and has previously been successfully applied in competitions. The general premise is that you can recover object localization via local maxima from predicted blobs.
\nnnU-Net is built for semantic segmentation. This also includes its expected data structure. To make it compatible with motor regression we store the ground truth as instance segmentation maps where each motor is encoded with a sphere (r=6 pixels) with a unique integer label. These spheres are treated by nnU-Net as segmentations and are passed through the data loading and augmentation pipeline as nnU-Net normally would, thus properly applying rotations, mirroring etc. At the end of the dataloading pipeline we inject a custom transform that converts each motor instance into a blob. Blobs are injected via a pixelwise max operator to properly allow for motors in close proximity.
\nWe use ‘EDT blobs’, basically 3D spheres that were transformed using the euclidean distance transform and rescaled to have a value range of [0, 1]. EDT spheres have a sharper ‘center’ than Gaussians. We also experimented with Gaussians and got very similar results. More experimentation would be needed to give a definitive answer on which one is better.
\nOur spheres have a radius of 25 pixels. This eases learning as the imbalance in the target tensors (dominated by 0’s) is lessened. We also got very good results with r=15. Again, we didn’t have enough time to experiment intensively.
\nHere are two examples for generated ETD blobs:
\n

As reported by others, MSE and soft Dice loss didn’t perform well on this task. We used binary cross-entropy loss computed only on the 20% worst voxels (the ones with the highest loss value, computed over the entire batch). This gave a small bump relative to regular BCE in early experiments as it counteracts the imbalance in the targets. Focal loss did not yield improvements over TopK20 BCE.
\nOur final model was trained with a batch size of 16 and a patch size of (128, 256, 256). Initial learning rate is 0.01 and is decayed over the course of the training using polyLR schedule (same as default nnU-Net). We train with SGD for 3500 epochs, where each epoch is defined as 250 iterations. Thus, our model is trained for 3500250=875,000 steps and has seen 3500250*16 = 14,000,000 patches.
\nWe leverage nnU-Net’s default strategy, which synergizes well with the instance segmentation internal representation used here. The sampling strategy is as follows:
\nWe apply heavy data augmentation during training, including:
\nWe refer to our code defining the transforms for further details, it’s too much (and not significant enough) to put all in here.
\nOthers report issues with loading and augmenting tomograms on the fly. We observed no such issues thanks to batchgeneratorsv2 fast augmentation implementations and nnU-Net’s efficient data infrastructure. We use blosc2 as a data format which allows partial reading from compressed files, enabling us to read only the part of the tomograms needed for the current patch. Moreover, by using reads via memmap, we can effectively cache some reads in RAM (done automatically via the OS) and therefore cut down on network bandwidth when reading data from a network drive. Data loading and augmentation is done on the CPU.
\nOur final model was trained on 8xA100 40GB using PyTorch's DDP. Training took a bit less than 7 days. Note that we only scaled compute at the very end. Our best model with less compute scored 0.86392 (private lb) and trained in ~18h on a single A100. Note that comparison is not ideal, as we spent much less time optimizing thresholds for the smaller model.
\nWhen running internal cross-validation we compute all motor detections and can then sweep for optimal threshold efficiently, allowing a comparison of models at their respective sweet spot and determining the threshold stability. After switching to the leaderboard for model optimization, we spend 5-10 submissions per model to determine the optimal threshold without following a systematic strategy. We did not do percentile thresholding and in hindsight, maybe should have, to be more efficient with submissions.
\nFor our final model, 0.15 was ideal for the public (0.86734) and private (0.87656) leaderboard. The ‘low’ threshold value is related to the use of EDT instead of Gaussian blobs.
We largely use nnU-Net’s inference infrastructure. Tomograms are dissected into a series of overlapping patches (50% overlap) and predictions are stitched together by weighting the central pixels of the currently predicted patch higher than the borders (Gaussian importance weighting). Test time augmentation is applied by mirroring along all axes. Predicted logits are clamped to [0, 1] by applying a sigmoid, followed by motor detection.
\nWe used the 2xT4 instances for the prediction and split the workload evenly between the two GPUs. We always use a single model, no ensembling. Inference takes 7-8 hours.
Predicted blobs are converted into motor predictions by performing non-maximum suppression. During cross-validation we need to allow for multiple motor detections per tomogram. We blur the predicted blobs with a 3D Gaussian (optional). We then detect motors as motors = torch.argwhere((prediction == max_pool(prediction, kernel_size=min_motor_distance)) & (prediction > threshold)).
The leaderboard only has tomograms with 0 or 1 motor, allowing us to simplify the inference logic. We simply find the maximum intensity in the prediction and check whether it is above the motor detection threshold.
\nOur model (single checkpoint, no ensembling) achieved a public score of 0.86734 and a private score of 0.87656. This ties our solution with Bartley. Unfortunately for us, Kaggle resolves ties by submission date, thus granting Bartley the (admittedly very well-deserved) 1st place. It takes quite some courage to make the last submission 9 days before the deadline. Kudos for that!
\nWe would very much like to provide proper ablations for the different design choices made for our final submission, but feel like this would only be misleading as we did not provide equal threshold tuning budget to all models and do not have checkpoints for proper 1:1 comparisons of identical models for interesting testing scenarios. That said (and please take it with a big grain of salt), here are some anchors (private scores, reporting best submission that fits the description):
\nData
\nLow compute (1xA100 40GB, 18h training) comparisons
\n=> Correcting the GT seems to have had a big impact. Effect of additional data unclear
\nHigh compute comparison makes no sense here as there are insufficient samples and results are all over the place.
Gaussian vs EDT blobs
\nLow compute (1xA100 40GB, 18h training) comparisons, using corrected official + bartleys data
\nFor everything else we have insufficient data points, too unbalanced threshold tuning budgets or experimental configurations that diverge too much.
\nWhile we were convinced that blob regression was the ideal task formulation we wanted to be doubly sure by trying other task formulations as well:
\nNone of these came close to the nnU-Net based blob regression performance in initial experiments and were quickly discontinued. Note that each of these solutions might have been optimized further to achieve competitive performance - we just didn’t invest more time and just tried them out of the box.
\nOther loss formulations like soft Dice, focal loss, MSE did not help. Standard BCE was similar in performance as the TopK variant we used here.
\nWe experimented with FP oversampling by increasing the likelihood of sampling patches where our previous model iteration generated FP motor predictions. This led to roughly equivalent performance and was discarded due to additional complexity.
\nWe joined late and didn’t devote enough time early, so we were under time pressure at the end and were greatly constricted by the submission limit. We definitely should have started sooner and made more systematic use of the submissions.
\nQuantile thresholding was reported by others to have been a good solution to overcome threshold optimization needs on the lb. We should have done that.
\nWe did not invest sufficient time in ensembling, leading to our final model to be a single checkpoint. There is likely some performance improvement to be had from using ensembling. Doing this effectively would have required us to train smaller/faster models and carefully balance ensembling with TTA and patch overlap in inference, so it’s not something we could have done overnight.
\nTo this day, we still don’t know what leads to the performance difference between internal CV and the leaderboard. We suspect there may be a distribution shift, for example, a different overall number of motors, different species of bacteria, or different scanners. It felt quite frustrating having to rely on the leaderboard so much. It would have been nice to have a training dataset that allows for meaningful internal validation so that we can test more ideas and are less constrained by the 5 submissions per day. So, essentially a training dataset that is more representative of the expected target distribution.
\nWe found it somewhat limiting to work with uint8-quantized intensities for a modality that typically operates in float32 (or occasionally uint16). It was also unclear what additional preprocessing steps (e.g., intensity clipping or normalization) were applied by the organizers, which introduced a degree of guesswork when integrating external data. While we understand this choice was likely made to be more inclusive to participants from the computer vision community, it felt like driving with the handbrake on. Providing full-precision data along with a conversion script to jpg/png would have offered the best of both worlds.
\nResizing to a common voxel spacing is a standard procedure in 3D images such as tomograms and would have been good to do here. We are wondering why voxel spacing information was not provided in the test set.
\nThere seem to be known errors in the training and test dataset which were not corrected by the organizers. While we understand that this would have upset some participants, we believe it would have been better to update the annotations, especially on the private test dataset to make sure we measure algorithm performance accurately.
\nWe thank BYU, especially Andrew Darley, for organizing and Kaggle for hosting this competition. We also want to thank Bartley, again, for generously sharing his data in an environment where he ran the risk that someone could use it to outperform his solution — that was a brave move. We furthermore want to give a shoutout to our Divisions of Medical Image Computing and Intelligent Medical Systems at the German Cancer Research Center (DKFZ) and to Helmholtz Imaging for being awesome. We also thank Lars Krämer for his excellent napari data inspection tool, which made manually inspecting motor annotations a breeze. Finally, a big thanks to the team — it was just an amazing experience to work on this competition together!
\nSubmission Notebook: https://www.kaggle.com/code/st3v3d/2nd-place-byu-challenge-submission-notebook
\nCode: https://github.com/MIC-DKFZ/kaggle_BYU_Locating_Bacterial-Flagellar_Motors_2025_solution
\nData and Checkpoint: https://drive.google.com/drive/folders/1uDLjtfIY0mDbwTPdvL0uWSRZHatJGjsS?usp=sharing
", "messages": [ { "id": "3226088", "postDate": "06/17/2025 08:31:59", "content": "A big thanks to @andrewjdarley, BYU and Kaggle for hosting this competition! Also big shoutout to @brendanartley for generously sharing his external data with everyone!
\nHere’s a brief rundown of our solution — it’s straightforward and easy to implement:
\nOur model achieved a score of 0.86734 / 0.87656 on the public/private leaderboard, tying for 1st place. Kaggle resolves ties by submission time. Unfortunate for us — but very well deserved by Bartley. Congratulations!
\nWe are a team of colleagues (scientists and PhD students) affiliated with the Divisions of Medical Image Computing and Intelligent Medical Systems at the German Cancer Research Center, as well as Helmholtz Imaging. Our expertise lies in 3D image analysis — particularly in solving 3D segmentation problems and developing infrastructure to bring algorithms into the clinic. For 4 out of 5 of us, this was the first time seriously competing in a Kaggle competition, although we do have a track record in medical image segmentation challenges.
\nWe use the competition data (n=648), Bartleys external data (n=1287) as well as another 555 publicly available images (n=2490 in total).
\nBartleys data. We do not use Bartleys data as provided by him and instead redownload all images using a modified version of his provided CziiCollector. This was done for two reasons: a) his resizing strategy was different than our approach (see preprocessing), requiring us to start from raw tomograms, and b) he only used a fraction of the data that were downloaded (62/104 datasets and 1287/3395 tomograms).
Corrections. We use 5-fold cross-validation predictions from an earlier model to generate predictions for all official tomograms and Bartleys data (n=1935). We configure a very low detection threshold to reduce FN, at the cost of increased FP. We encode GT and prediction as instance segmentation maps with spheres representing motors and then manually inspect all tomograms for annotation errors using the napari data inspection tool. 213 tomograms were corrected, with the most common errors being:
\nWe emphasize that prior to this competition, none of our team members were intimately familiar with cryoET or the manifestation of bacterial morphology. Throughout the challenge, we trained our biological neural networks using the provided training data, ChatGPT, and Google Image Search. As such, while we made a genuine effort, our manual corrections may not be entirely accurate.
\nAdditional data. As outlined above, Bartley's dataset only covers a fraction of the tomograms that are downloaded by his CziiCollector. Note that the downloaded data is structured into datasets (n=104). We use one of our models (around 0.85/0.86 public) to predict all tomograms that were not already part of Bartley’s collection. We sample additional data using the following strategy:
Our additional data encompasses 555 additional tomograms. These 555 cases were then manually corrected using the same strategy as above. This brought the number of training cases up to 2490 from 1935.
\nWhen merging external data we emulate the intensity processing of the challenge to the external data by clipping to the 0.1 and 99.9th percentiles and converting to uint8, similar to how Bartley did it. This is only done to bring the data in line with the official data (and test set).
\nSince voxel spacing will not be available for the test set (which would have been preferable), we decided to resize all tomograms such that the longest edge is 512 pixels long.
\nnnU-Net automatically performs z-score normalization. Each image is converted to float32 and normalized individually by subtracting its mean and dividing by its standard deviation. As the original data is uint8, this step is potentially wasteful, but we did not have time to investigate other strategies and, frankly, did not see potential for improvement here.
We use nnU-Net’s ResEnc, which is essentially a UNet with a residual encoder and a lightweight convolutional decoder. We also experimented with nnU-Net’s standard UNet and, honestly, did not see a significant performance difference. Either one performed very well.
\nWe train all models from scratch. Initially, we performed 5-fold cross-validation to weed out bad design choices. Blob regression allows for multiple motor predictions per image and we developed an internal evaluation scheme that was compatible with arbitrary motor numbers, thus allowing us to use all images of the train data for internal validation. Later on we relied on the leaderboard to provide feedback as the gap we observed between internal performance and public score made us distrust internal results for final model optimization.
\nBlob regression is a standard approach for landmark detection and has previously been successfully applied in competitions. The general premise is that you can recover object localization via local maxima from predicted blobs.
\nnnU-Net is built for semantic segmentation. This also includes its expected data structure. To make it compatible with motor regression we store the ground truth as instance segmentation maps where each motor is encoded with a sphere (r=6 pixels) with a unique integer label. These spheres are treated by nnU-Net as segmentations and are passed through the data loading and augmentation pipeline as nnU-Net normally would, thus properly applying rotations, mirroring etc. At the end of the dataloading pipeline we inject a custom transform that converts each motor instance into a blob. Blobs are injected via a pixelwise max operator to properly allow for motors in close proximity.
\nWe use ‘EDT blobs’, basically 3D spheres that were transformed using the euclidean distance transform and rescaled to have a value range of [0, 1]. EDT spheres have a sharper ‘center’ than Gaussians. We also experimented with Gaussians and got very similar results. More experimentation would be needed to give a definitive answer on which one is better.
\nOur spheres have a radius of 25 pixels. This eases learning as the imbalance in the target tensors (dominated by 0’s) is lessened. We also got very good results with r=15. Again, we didn’t have enough time to experiment intensively.
\nHere are two examples for generated ETD blobs:
\n
As reported by others, MSE and soft Dice loss didn’t perform well on this task. We used binary cross-entropy loss computed only on the 20% worst voxels (the ones with the highest loss value, computed over the entire batch). This gave a small bump relative to regular BCE in early experiments as it counteracts the imbalance in the targets. Focal loss did not yield improvements over TopK20 BCE.
\nOur final model was trained with a batch size of 16 and a patch size of (128, 256, 256). Initial learning rate is 0.01 and is decayed over the course of the training using polyLR schedule (same as default nnU-Net). We train with SGD for 3500 epochs, where each epoch is defined as 250 iterations. Thus, our model is trained for 3500250=875,000 steps and has seen 3500250*16 = 14,000,000 patches.
\nWe leverage nnU-Net’s default strategy, which synergizes well with the instance segmentation internal representation used here. The sampling strategy is as follows:
\nWe apply heavy data augmentation during training, including:
\nWe refer to our code defining the transforms for further details, it’s too much (and not significant enough) to put all in here.
\nOthers report issues with loading and augmenting tomograms on the fly. We observed no such issues thanks to batchgeneratorsv2 fast augmentation implementations and nnU-Net’s efficient data infrastructure. We use blosc2 as a data format which allows partial reading from compressed files, enabling us to read only the part of the tomograms needed for the current patch. Moreover, by using reads via memmap, we can effectively cache some reads in RAM (done automatically via the OS) and therefore cut down on network bandwidth when reading data from a network drive. Data loading and augmentation is done on the CPU.
\nOur final model was trained on 8xA100 40GB using PyTorch's DDP. Training took a bit less than 7 days. Note that we only scaled compute at the very end. Our best model with less compute scored 0.86392 (private lb) and trained in ~18h on a single A100. Note that comparison is not ideal, as we spent much less time optimizing thresholds for the smaller model.
\nWhen running internal cross-validation we compute all motor detections and can then sweep for optimal threshold efficiently, allowing a comparison of models at their respective sweet spot and determining the threshold stability. After switching to the leaderboard for model optimization, we spend 5-10 submissions per model to determine the optimal threshold without following a systematic strategy. We did not do percentile thresholding and in hindsight, maybe should have, to be more efficient with submissions.
\nFor our final model, 0.15 was ideal for the public (0.86734) and private (0.87656) leaderboard. The ‘low’ threshold value is related to the use of EDT instead of Gaussian blobs.
We largely use nnU-Net’s inference infrastructure. Tomograms are dissected into a series of overlapping patches (50% overlap) and predictions are stitched together by weighting the central pixels of the currently predicted patch higher than the borders (Gaussian importance weighting). Test time augmentation is applied by mirroring along all axes. Predicted logits are clamped to [0, 1] by applying a sigmoid, followed by motor detection.
\nWe used the 2xT4 instances for the prediction and split the workload evenly between the two GPUs. We always use a single model, no ensembling. Inference takes 7-8 hours.
Predicted blobs are converted into motor predictions by performing non-maximum suppression. During cross-validation we need to allow for multiple motor detections per tomogram. We blur the predicted blobs with a 3D Gaussian (optional). We then detect motors as motors = torch.argwhere((prediction == max_pool(prediction, kernel_size=min_motor_distance)) & (prediction > threshold)).
The leaderboard only has tomograms with 0 or 1 motor, allowing us to simplify the inference logic. We simply find the maximum intensity in the prediction and check whether it is above the motor detection threshold.
\nOur model (single checkpoint, no ensembling) achieved a public score of 0.86734 and a private score of 0.87656. This ties our solution with Bartley. Unfortunately for us, Kaggle resolves ties by submission date, thus granting Bartley the (admittedly very well-deserved) 1st place. It takes quite some courage to make the last submission 9 days before the deadline. Kudos for that!
\nWe would very much like to provide proper ablations for the different design choices made for our final submission, but feel like this would only be misleading as we did not provide equal threshold tuning budget to all models and do not have checkpoints for proper 1:1 comparisons of identical models for interesting testing scenarios. That said (and please take it with a big grain of salt), here are some anchors (private scores, reporting best submission that fits the description):
\nData
\nLow compute (1xA100 40GB, 18h training) comparisons
\n=> Correcting the GT seems to have had a big impact. Effect of additional data unclear
\nHigh compute comparison makes no sense here as there are insufficient samples and results are all over the place.
Gaussian vs EDT blobs
\nLow compute (1xA100 40GB, 18h training) comparisons, using corrected official + bartleys data
\nFor everything else we have insufficient data points, too unbalanced threshold tuning budgets or experimental configurations that diverge too much.
\nWhile we were convinced that blob regression was the ideal task formulation we wanted to be doubly sure by trying other task formulations as well:
\nNone of these came close to the nnU-Net based blob regression performance in initial experiments and were quickly discontinued. Note that each of these solutions might have been optimized further to achieve competitive performance - we just didn’t invest more time and just tried them out of the box.
\nOther loss formulations like soft Dice, focal loss, MSE did not help. Standard BCE was similar in performance as the TopK variant we used here.
\nWe experimented with FP oversampling by increasing the likelihood of sampling patches where our previous model iteration generated FP motor predictions. This led to roughly equivalent performance and was discarded due to additional complexity.
\nWe joined late and didn’t devote enough time early, so we were under time pressure at the end and were greatly constricted by the submission limit. We definitely should have started sooner and made more systematic use of the submissions.
\nQuantile thresholding was reported by others to have been a good solution to overcome threshold optimization needs on the lb. We should have done that.
\nWe did not invest sufficient time in ensembling, leading to our final model to be a single checkpoint. There is likely some performance improvement to be had from using ensembling. Doing this effectively would have required us to train smaller/faster models and carefully balance ensembling with TTA and patch overlap in inference, so it’s not something we could have done overnight.
\nTo this day, we still don’t know what leads to the performance difference between internal CV and the leaderboard. We suspect there may be a distribution shift, for example, a different overall number of motors, different species of bacteria, or different scanners. It felt quite frustrating having to rely on the leaderboard so much. It would have been nice to have a training dataset that allows for meaningful internal validation so that we can test more ideas and are less constrained by the 5 submissions per day. So, essentially a training dataset that is more representative of the expected target distribution.
\nWe found it somewhat limiting to work with uint8-quantized intensities for a modality that typically operates in float32 (or occasionally uint16). It was also unclear what additional preprocessing steps (e.g., intensity clipping or normalization) were applied by the organizers, which introduced a degree of guesswork when integrating external data. While we understand this choice was likely made to be more inclusive to participants from the computer vision community, it felt like driving with the handbrake on. Providing full-precision data along with a conversion script to jpg/png would have offered the best of both worlds.
\nResizing to a common voxel spacing is a standard procedure in 3D images such as tomograms and would have been good to do here. We are wondering why voxel spacing information was not provided in the test set.
\nThere seem to be known errors in the training and test dataset which were not corrected by the organizers. While we understand that this would have upset some participants, we believe it would have been better to update the annotations, especially on the private test dataset to make sure we measure algorithm performance accurately.
\nWe thank BYU, especially Andrew Darley, for organizing and Kaggle for hosting this competition. We also want to thank Bartley, again, for generously sharing his data in an environment where he ran the risk that someone could use it to outperform his solution — that was a brave move. We furthermore want to give a shoutout to our Divisions of Medical Image Computing and Intelligent Medical Systems at the German Cancer Research Center (DKFZ) and to Helmholtz Imaging for being awesome. We also thank Lars Krämer for his excellent napari data inspection tool, which made manually inspecting motor annotations a breeze. Finally, a big thanks to the team — it was just an amazing experience to work on this competition together!
\nSubmission Notebook: https://www.kaggle.com/code/st3v3d/2nd-place-byu-challenge-submission-notebook
\nCode: https://github.com/MIC-DKFZ/kaggle_BYU_Locating_Bacterial-Flagellar_Motors_2025_solution
\nData and Checkpoint: https://drive.google.com/drive/folders/1uDLjtfIY0mDbwTPdvL0uWSRZHatJGjsS?usp=sharing
", "rawMarkdown": "# 2nd Place - nnU-Net + blob regression\nA big thanks to @andrewjdarley, BYU and Kaggle for hosting this competition! Also big shoutout to @brendanartley for generously sharing his external data with everyone!\n\n## Overview (TLDR)\nHere’s a brief rundown of our solution — it’s straightforward and easy to implement:\n- We formulate the motor localization task as blob regression, optimized using a TopK (20%) BCE loss.\n- We build on [nnU-Net](https://github.com/MIC-DKFZ/nnUNet), the leading framework for 3D medical image segmentation. It can be adapted for blob regression with a few simple tricks.\n- Our model is a 3D U-Net with a residual encoder, trained from scratch.\n- We use the competition data, Bartley’s data, and 555 additional public tomograms. Motor annotations were manually corrected.\n- Inference is done with a single model and light test-time augmentation (mirroring).\n\nOur model achieved a score of 0.86734 / 0.87656 on the public/private leaderboard, tying for 1st place. Kaggle resolves ties by submission time. Unfortunate for us — but very well deserved by Bartley. Congratulations!\n\n## Who are we?\nWe are a team of colleagues (scientists and PhD students) affiliated with the [Divisions of Medical Image Computing](https://www.dkfz.de/en/medical-image-computing) and [Intelligent Medical Systems](https://www.dkfz.de/en/imsy) at the German Cancer Research Center, as well as [Helmholtz Imaging](https://helmholtz-imaging.de/). Our expertise lies in 3D image analysis — particularly in solving 3D segmentation problems and developing infrastructure to bring algorithms into the clinic. For 4 out of 5 of us, this was the first time seriously competing in a Kaggle competition, although we do have a track record in medical image segmentation challenges.\n\n## Data used\nWe use the competition data (n=648), [Bartleys external data](https://www.kaggle.com/datasets/brendanartley/cryoet-flagellar-motors-dataset) (n=1287) as well as another 555 publicly available images (n=2490 in total).\n\n**Bartleys data.** We do not use Bartleys data as provided by him and instead redownload all images using a modified version of his provided [`CziiCollector`](https://www.kaggle.com/code/brendanartley/flagellar-motors-dataset-code). This was done for two reasons: a) his resizing strategy was different than our approach (see preprocessing), requiring us to start from raw tomograms, and b) he only used a fraction of the data that were downloaded (62/104 datasets and 1287/3395 tomograms).\n\n**Corrections.** We use 5-fold cross-validation predictions from an earlier model to generate predictions for all official tomograms and Bartleys data (n=1935). We configure a very low detection threshold to reduce FN, at the cost of increased FP. We encode GT and prediction as instance segmentation maps with spheres representing motors and then manually inspect all tomograms for annotation errors using the [napari data inspection tool](https://github.com/MIC-DKFZ/napari-data-inspection). 213 tomograms were corrected, with the most common errors being: \n- missing motors in images with many motor instances\n- mistakenly annotated motors in images where no flagellum was visible\n- motors missing close to the edge of the image.\n\nWe emphasize that prior to this competition, none of our team members were intimately familiar with cryoET or the manifestation of bacterial morphology. Throughout the challenge, we trained our biological neural networks using the provided training data, ChatGPT, and Google Image Search. As such, while we made a genuine effort, our manual corrections may not be entirely accurate.\n\n**Additional data.** As outlined above, Bartley's dataset only covers a fraction of the tomograms that are downloaded by his `CziiCollector`. Note that the downloaded data is structured into datasets (n=104). We use one of our models (around 0.85/0.86 public) to predict all tomograms that were not already part of Bartley’s collection. We sample additional data using the following strategy:\n- Out of all the tomograms with predicted motors (around 500), randomly sample 250\n- For each dataset, sample 4 random additional tomograms (less if fewer tomograms are available) that do not have motors.\n- Finally, increase motor appearance diversity by ensuring we include at least 4 motor-containing tomograms per dataset (if a dataset has that many, most have less!)\n\nOur additional data encompasses 555 additional tomograms. These 555 cases were then manually corrected using the same strategy as above. This brought the number of training cases up to 2490 from 1935.\n\nWhen merging external data we emulate the intensity processing of the challenge to the external data by clipping to the 0.1 and 99.9th percentiles and converting to uint8, similar to how Bartley did it. This is only done to bring the data in line with the official data (and test set).\n\n## Preprocessing\nSince voxel spacing will not be available for the test set (which would have been preferable), we decided to resize all tomograms such that the longest edge is 512 pixels long.\nnnU-Net automatically performs z-score normalization. Each image is converted to float32 and normalized individually by subtracting its mean and dividing by its standard deviation. As the original data is uint8, this step is potentially wasteful, but we did not have time to investigate other strategies and, frankly, did not see potential for improvement here.\n\n## Network architecture\nWe use nnU-Net’s ResEnc, which is essentially a UNet with a residual encoder and a lightweight convolutional decoder. We also experimented with nnU-Net’s standard UNet and, honestly, did not see a significant performance difference. Either one performed very well.\n\n## Training Procedure\nWe train all models from scratch. Initially, we performed 5-fold cross-validation to weed out bad design choices. Blob regression allows for multiple motor predictions per image and we developed an internal evaluation scheme that was compatible with arbitrary motor numbers, thus allowing us to use all images of the train data for internal validation. Later on we relied on the leaderboard to provide feedback as the gap we observed between internal performance and public score made us distrust internal results for final model optimization. \n\n### Blob Regression\nBlob regression is a standard approach for landmark detection and [has previously been successfully applied in competitions](https://www.kaggle.com/competitions/czii-cryo-et-object-identification). The general premise is that you can recover object localization via local maxima from predicted blobs.\n\n#### How we used nnU-Net for regression\nnnU-Net is built for semantic segmentation. This also includes its expected data structure. To make it compatible with motor regression we store the ground truth as instance segmentation maps where each motor is encoded with a sphere (r=6 pixels) with a unique integer label. These spheres are treated by nnU-Net as segmentations and are passed through the data loading and augmentation pipeline as nnU-Net normally would, thus properly applying rotations, mirroring etc. At the end of the dataloading pipeline we inject a custom transform that converts each motor instance into a blob. Blobs are injected via a pixelwise max operator to properly allow for motors in close proximity.\n\n#### Blob generation\nWe use ‘EDT blobs’, basically 3D spheres that were transformed using the euclidean distance transform and rescaled to have a value range of [0, 1]. EDT spheres have a sharper ‘center’ than Gaussians. We also experimented with Gaussians and got very similar results. More experimentation would be needed to give a definitive answer on which one is better.\n\nOur spheres have a radius of 25 pixels. This eases learning as the imbalance in the target tensors (dominated by 0’s) is lessened. We also got very good results with r=15. Again, we didn’t have enough time to experiment intensively.\n\nHere are two examples for generated ETD blobs:\n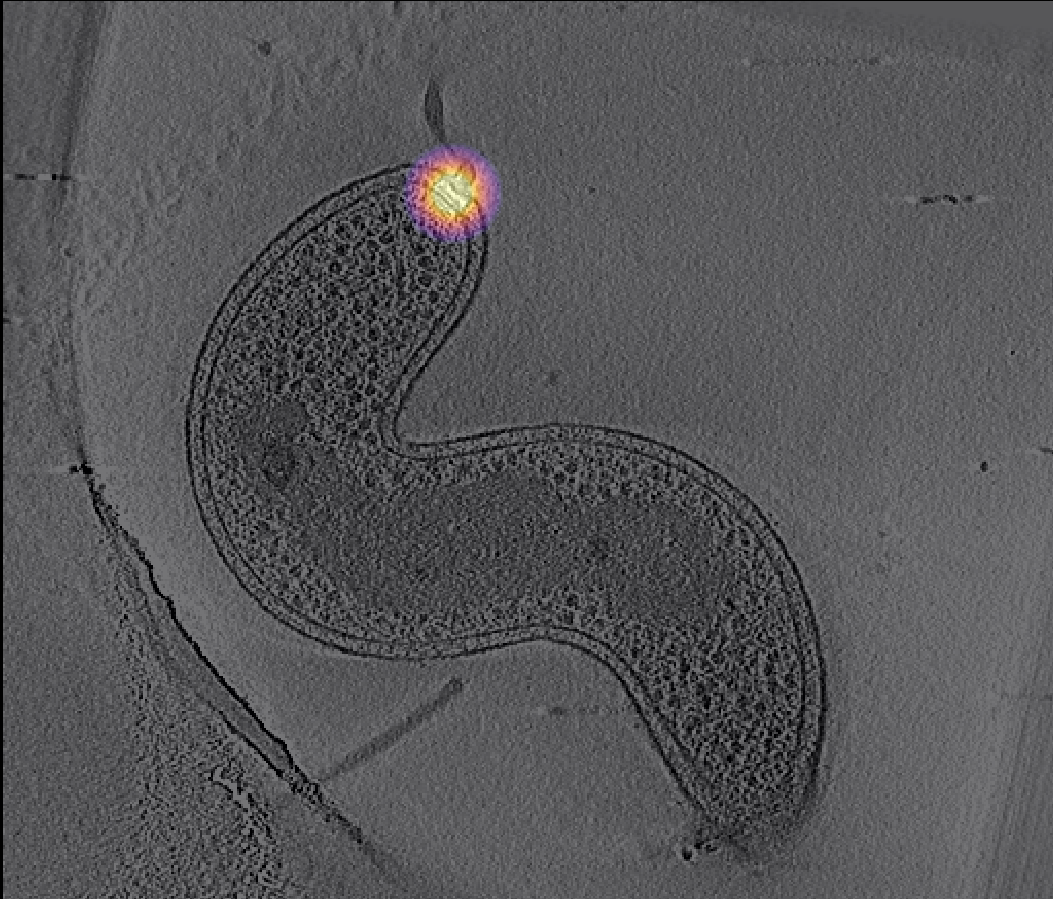\n\n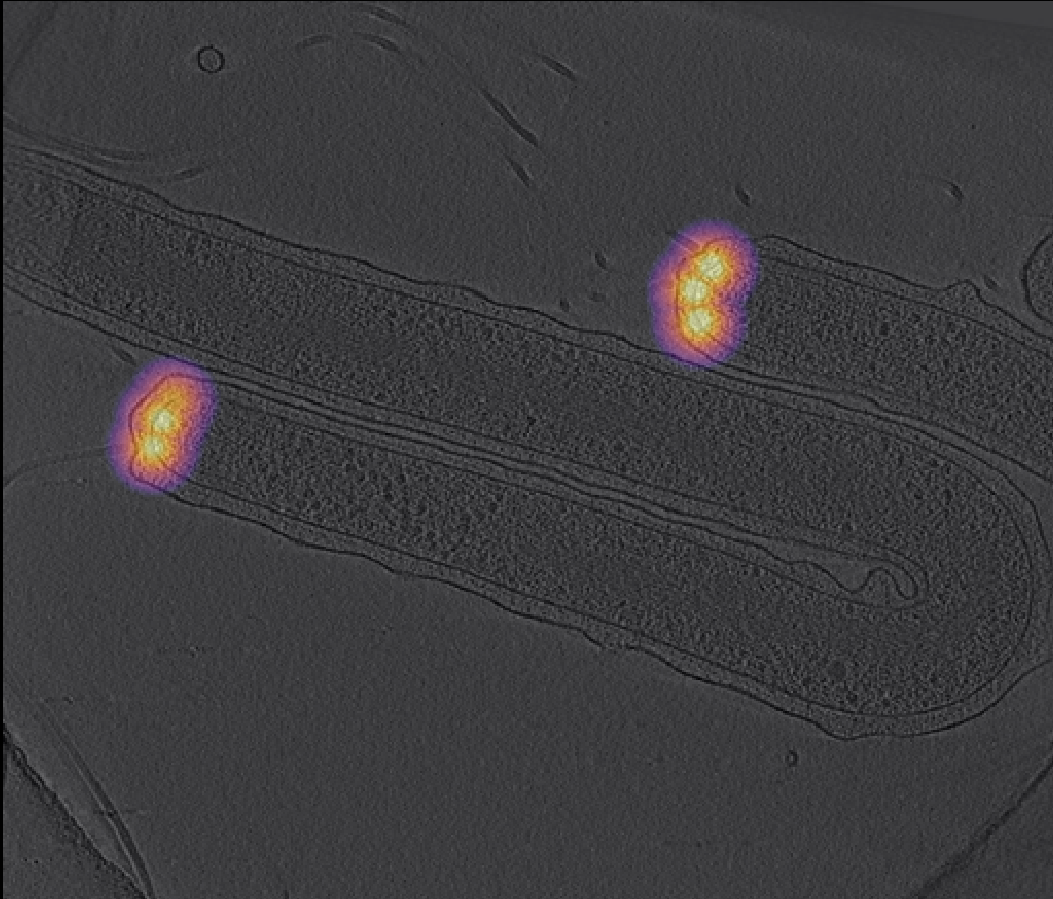\n\n#### Loss function\nAs reported by others, MSE and soft Dice loss didn’t perform well on this task. We used binary cross-entropy loss computed only on the 20% worst voxels (the ones with the highest loss value, computed over the entire batch). This gave a small bump relative to regular BCE in early experiments as it counteracts the imbalance in the targets. Focal loss did not yield improvements over TopK20 BCE.\n\n### Hyperparameters\nOur final model was trained with a batch size of 16 and a patch size of (128, 256, 256). Initial learning rate is 0.01 and is decayed over the course of the training using polyLR schedule (same as default nnU-Net). We train with SGD for 3500 epochs, where each epoch is defined as 250 iterations. Thus, our model is trained for 3500*250=875,000 steps and has seen 3500*250*16 = 14,000,000 patches.\n\n### Patch sampling strategy\nWe leverage nnU-Net’s default strategy, which synergizes well with the instance segmentation internal representation used here. The sampling strategy is as follows:\n- For 67% of the samples in the batch:\n - Pick a random training case\n - Pick a random patch from that case\n- For the remaining 33% (min 1 sample per batch!)\n - Pick a random training case\n - If this case has any motors:\n - Pick a random motor instance\n - Pick a patch that encompasses this motor\n - If no motor is present, fall back to random sampling\n\n### Data augmentation\nWe apply heavy data augmentation during training, including:\n- Random intensity clipping (10%)\n- Rotation and Scaling (30% each)\n- Rot90 (50%)\n- Transpose compatible axes (axes of same shape = the two 256 axes, see patch size, 50%)\n- OneOf(MedianFilter (10%), GaussianBlur (10%))\n- Gaussian Noise (15%)\n- Additive Brightness (5%)\n- OneOf(Contrast (15%), Multiplicative Brightness (15%))\n- Simulate low Resolution (7.5%)\n- Gamma (20%)\n- Gamma (inverted image) (20%)\n- Mirroring (50% for each axis, can mirror multiple axes)\n- Additive Brightness Gradient (10%)\n- Local Gamma Gradient (10%)\n- Sharpening (10%)\n- Image inversion (10%)\n\nWe refer to our [code defining the transforms](https://github.com/MIC-DKFZ/kaggle_BYU_Locating_Bacterial-Flagellar_Motors_2025_solution/blob/eafb1dfefccba71d629a64fc6619207d25197c42/nnunetv2/training/nnUNetTrainer/project_specific/kaggle2025_byu/data_augmentation/more_DA.py#L90) for further details, it’s too much (and not significant enough) to put all in here.\n\n### Dataloading Infrastructure\nOthers report issues with loading and augmenting tomograms on the fly. We observed no such issues thanks to [batchgeneratorsv2](https://github.com/MIC-DKFZ/batchgeneratorsv2) fast augmentation implementations and nnU-Net’s efficient data infrastructure. We use [blosc2](https://github.com/Blosc/python-blosc2) as a data format which allows partial reading from compressed files, enabling us to read only the part of the tomograms needed for the current patch. Moreover, by using reads via memmap, we can effectively cache some reads in RAM (done automatically via the OS) and therefore cut down on network bandwidth when reading data from a network drive. Data loading and augmentation is done on the CPU.\n\n### Compute Requirements\nOur final model was trained on 8xA100 40GB using PyTorch's DDP. Training took a bit less than 7 days. Note that we only scaled compute at the very end. Our best model with less compute scored 0.86392 (private lb) and trained in ~18h on a single A100. Note that comparison is not ideal, as we spent much less time optimizing thresholds for the smaller model.\n\n### Threshold tuning\nWhen running internal cross-validation we compute all motor detections and can then sweep for optimal threshold efficiently, allowing a comparison of models at their respective sweet spot and determining the threshold stability. After switching to the leaderboard for model optimization, we spend 5-10 submissions per model to determine the optimal threshold without following a systematic strategy. We did not do percentile thresholding and in hindsight, maybe should have, to be more efficient with submissions.\nFor our final model, 0.15 was ideal for the public (0.86734) and private (0.87656) leaderboard. The ‘low’ threshold value is related to the use of EDT instead of Gaussian blobs.\n\n## Inference\nWe largely use nnU-Net’s inference infrastructure. Tomograms are dissected into a series of overlapping patches (50% overlap) and predictions are stitched together by weighting the central pixels of the currently predicted patch higher than the borders (Gaussian importance weighting). Test time augmentation is applied by mirroring along all axes. Predicted logits are clamped to [0, 1] by applying a sigmoid, followed by motor detection.\nWe used the 2xT4 instances for the prediction and split the workload evenly between the two GPUs. We always use a single model, no ensembling. Inference takes 7-8 hours.\n\n### Postprocessing\n\n#### Cross-validation\nPredicted blobs are converted into motor predictions by performing non-maximum suppression. During cross-validation we need to allow for multiple motor detections per tomogram. We blur the predicted blobs with a 3D Gaussian (optional). We then detect motors as `motors = torch.argwhere((prediction == max_pool(prediction, kernel_size=min_motor_distance)) & (prediction > threshold))`.\n\n#### Leaderboard\nThe leaderboard only has tomograms with 0 or 1 motor, allowing us to simplify the inference logic. We simply find the maximum intensity in the prediction and check whether it is above the motor detection threshold.\n\n## Results\nOur model (single checkpoint, no ensembling) achieved a public score of 0.86734 and a private score of 0.87656. This ties our solution with Bartley. Unfortunately for us, Kaggle resolves ties by submission date, thus granting Bartley the (admittedly very well-deserved) 1st place. It takes quite some courage to make the last submission 9 days before the deadline. Kudos for that!\n\nWe would very much like to provide proper ablations for the different design choices made for our final submission, but feel like this would only be misleading as we did not provide equal threshold tuning budget to all models and do not have checkpoints for proper 1:1 comparisons of identical models for interesting testing scenarios. That said (and please take it with a big grain of salt), here are some anchors (private scores, reporting best submission that fits the description):\n\n**Data**\n\nLow compute (1xA100 40GB, 18h training) comparisons\n- Uncorrected official: N/A (sorry)\n- Uncorrected official + bartleys data: 0.83181\n- Corrected official + bartleys data: 0.86253\n- Corrected official + bartleys data and 555 additional cases: 0.86392 (probably lower than it should be due to insufficient threshold optimization!)\n\n=> Correcting the GT seems to have had a big impact. Effect of additional data unclear\nHigh compute comparison makes no sense here as there are insufficient samples and results are all over the place.\n\n**Gaussian vs EDT blobs**\n\nLow compute (1xA100 40GB, 18h training) comparisons, using corrected official + bartleys data\n- Best EDT: 0.84888 (r=25)\n- Best Gaussian: 0.84513 (r=15)\n\nFor everything else we have insufficient data points, too unbalanced threshold tuning budgets or experimental configurations that diverge too much. \n\n## What did not work?\nWhile we were convinced that blob regression was the ideal task formulation we wanted to be doubly sure by trying other task formulations as well:\n- 3D Segmentation with postprocessing (also nnU-Net)\n- YOLO-based 2D detection\n- [nnDetection](https://github.com/MIC-DKFZ/nnDetection)-based 3D detection\n- Landmark detection with [nnLandmark](https://arxiv.org/abs/2504.06742) (also does blob regression but uses MSE loss)\n\nNone of these came close to the nnU-Net based blob regression performance in initial experiments and were quickly discontinued. Note that each of these solutions might have been optimized further to achieve competitive performance - we just didn’t invest more time and just tried them out of the box.\n\nOther loss formulations like soft Dice, focal loss, MSE did not help. Standard BCE was similar in performance as the TopK variant we used here.\n\nWe experimented with FP oversampling by increasing the likelihood of sampling patches where our previous model iteration generated FP motor predictions. This led to roughly equivalent performance and was discarded due to additional complexity.\n\n## What else should we have done?\nWe joined late and didn’t devote enough time early, so we were under time pressure at the end and were greatly constricted by the submission limit. We definitely should have started sooner and made more systematic use of the submissions.\n\nQuantile thresholding was reported by others to have been a good solution to overcome threshold optimization needs on the lb. We should have done that.\n\nWe did not invest sufficient time in ensembling, leading to our final model to be a single checkpoint. There is likely some performance improvement to be had from using ensembling. Doing this effectively would have required us to train smaller/faster models and carefully balance ensembling with TTA and patch overlap in inference, so it’s not something we could have done overnight.\n\n## What would we have wished for?\nTo this day, we still don’t know what leads to the performance difference between internal CV and the leaderboard. We suspect there may be a distribution shift, for example, a different overall number of motors, different species of bacteria, or different scanners. It felt quite frustrating having to rely on the leaderboard so much. It would have been nice to have a training dataset that allows for meaningful internal validation so that we can test more ideas and are less constrained by the 5 submissions per day. So, essentially a training dataset that is more representative of the expected target distribution.\n\nWe found it somewhat limiting to work with uint8-quantized intensities for a modality that typically operates in float32 (or occasionally uint16). It was also unclear what additional preprocessing steps (e.g., intensity clipping or normalization) were applied by the organizers, which introduced a degree of guesswork when integrating external data. While we understand this choice was likely made to be more inclusive to participants from the computer vision community, it felt like driving with the handbrake on. Providing full-precision data along with a conversion script to jpg/png would have offered the best of both worlds.\n\nResizing to a common voxel spacing is a standard procedure in 3D images such as tomograms and would have been good to do here. We are wondering why voxel spacing information was not provided in the test set.\n\nThere seem to be [known errors in the training and test dataset](https://www.kaggle.com/competitions/byu-locating-bacterial-flagellar-motors-2025/discussion/582948) which were not corrected by the organizers. While we understand that this would have upset some participants, we believe it would have been better to update the annotations, especially on the private test dataset to make sure we measure algorithm performance accurately.\n\n## Acknowledgements\nWe thank BYU, especially Andrew Darley, for organizing and Kaggle for hosting this competition. We also want to thank Bartley, again, for generously sharing his data in an environment where he ran the risk that someone could use it to outperform his solution — that was a brave move. We furthermore want to give a shoutout to our Divisions of Medical Image Computing and Intelligent Medical Systems at the German Cancer Research Center (DKFZ) and to Helmholtz Imaging for being awesome. We also thank Lars Krämer for his excellent [napari data inspection tool](https://github.com/MIC-DKFZ/napari-data-inspection), which made manually inspecting motor annotations a breeze. Finally, a big thanks to the team — it was just an amazing experience to work on this competition together!\n\n## Resources\nSubmission Notebook:Thanks for the detailed write up and the well organized code base!
", "rawMarkdown": "Thanks for the detailed write up and the well organized code base!", "votes": null } ], "comments": [ { "id": 3227299, "author_name": "elonsdale", "author_url": "", "post_date": "06/18/2025 19:35:38", "content": "Thanks for the detailed write up and the well organized code base!
", "votes": null, "replies": [] } ], "raw_markdown_by_id": { "3226088": "# 2nd Place - nnU-Net + blob regression\nA big thanks to @andrewjdarley, BYU and Kaggle for hosting this competition! Also big shoutout to @brendanartley for generously sharing his external data with everyone!\n\n## Overview (TLDR)\nHere’s a brief rundown of our solution — it’s straightforward and easy to implement:\n- We formulate the motor localization task as blob regression, optimized using a TopK (20%) BCE loss.\n- We build on [nnU-Net](https://github.com/MIC-DKFZ/nnUNet), the leading framework for 3D medical image segmentation. It can be adapted for blob regression with a few simple tricks.\n- Our model is a 3D U-Net with a residual encoder, trained from scratch.\n- We use the competition data, Bartley’s data, and 555 additional public tomograms. Motor annotations were manually corrected.\n- Inference is done with a single model and light test-time augmentation (mirroring).\n\nOur model achieved a score of 0.86734 / 0.87656 on the public/private leaderboard, tying for 1st place. Kaggle resolves ties by submission time. Unfortunate for us — but very well deserved by Bartley. Congratulations!\n\n## Who are we?\nWe are a team of colleagues (scientists and PhD students) affiliated with the [Divisions of Medical Image Computing](https://www.dkfz.de/en/medical-image-computing) and [Intelligent Medical Systems](https://www.dkfz.de/en/imsy) at the German Cancer Research Center, as well as [Helmholtz Imaging](https://helmholtz-imaging.de/). Our expertise lies in 3D image analysis — particularly in solving 3D segmentation problems and developing infrastructure to bring algorithms into the clinic. For 4 out of 5 of us, this was the first time seriously competing in a Kaggle competition, although we do have a track record in medical image segmentation challenges.\n\n## Data used\nWe use the competition data (n=648), [Bartleys external data](https://www.kaggle.com/datasets/brendanartley/cryoet-flagellar-motors-dataset) (n=1287) as well as another 555 publicly available images (n=2490 in total).\n\n**Bartleys data.** We do not use Bartleys data as provided by him and instead redownload all images using a modified version of his provided [`CziiCollector`](https://www.kaggle.com/code/brendanartley/flagellar-motors-dataset-code). This was done for two reasons: a) his resizing strategy was different than our approach (see preprocessing), requiring us to start from raw tomograms, and b) he only used a fraction of the data that were downloaded (62/104 datasets and 1287/3395 tomograms).\n\n**Corrections.** We use 5-fold cross-validation predictions from an earlier model to generate predictions for all official tomograms and Bartleys data (n=1935). We configure a very low detection threshold to reduce FN, at the cost of increased FP. We encode GT and prediction as instance segmentation maps with spheres representing motors and then manually inspect all tomograms for annotation errors using the [napari data inspection tool](https://github.com/MIC-DKFZ/napari-data-inspection). 213 tomograms were corrected, with the most common errors being: \n- missing motors in images with many motor instances\n- mistakenly annotated motors in images where no flagellum was visible\n- motors missing close to the edge of the image.\n\nWe emphasize that prior to this competition, none of our team members were intimately familiar with cryoET or the manifestation of bacterial morphology. Throughout the challenge, we trained our biological neural networks using the provided training data, ChatGPT, and Google Image Search. As such, while we made a genuine effort, our manual corrections may not be entirely accurate.\n\n**Additional data.** As outlined above, Bartley's dataset only covers a fraction of the tomograms that are downloaded by his `CziiCollector`. Note that the downloaded data is structured into datasets (n=104). We use one of our models (around 0.85/0.86 public) to predict all tomograms that were not already part of Bartley’s collection. We sample additional data using the following strategy:\n- Out of all the tomograms with predicted motors (around 500), randomly sample 250\n- For each dataset, sample 4 random additional tomograms (less if fewer tomograms are available) that do not have motors.\n- Finally, increase motor appearance diversity by ensuring we include at least 4 motor-containing tomograms per dataset (if a dataset has that many, most have less!)\n\nOur additional data encompasses 555 additional tomograms. These 555 cases were then manually corrected using the same strategy as above. This brought the number of training cases up to 2490 from 1935.\n\nWhen merging external data we emulate the intensity processing of the challenge to the external data by clipping to the 0.1 and 99.9th percentiles and converting to uint8, similar to how Bartley did it. This is only done to bring the data in line with the official data (and test set).\n\n## Preprocessing\nSince voxel spacing will not be available for the test set (which would have been preferable), we decided to resize all tomograms such that the longest edge is 512 pixels long.\nnnU-Net automatically performs z-score normalization. Each image is converted to float32 and normalized individually by subtracting its mean and dividing by its standard deviation. As the original data is uint8, this step is potentially wasteful, but we did not have time to investigate other strategies and, frankly, did not see potential for improvement here.\n\n## Network architecture\nWe use nnU-Net’s ResEnc, which is essentially a UNet with a residual encoder and a lightweight convolutional decoder. We also experimented with nnU-Net’s standard UNet and, honestly, did not see a significant performance difference. Either one performed very well.\n\n## Training Procedure\nWe train all models from scratch. Initially, we performed 5-fold cross-validation to weed out bad design choices. Blob regression allows for multiple motor predictions per image and we developed an internal evaluation scheme that was compatible with arbitrary motor numbers, thus allowing us to use all images of the train data for internal validation. Later on we relied on the leaderboard to provide feedback as the gap we observed between internal performance and public score made us distrust internal results for final model optimization. \n\n### Blob Regression\nBlob regression is a standard approach for landmark detection and [has previously been successfully applied in competitions](https://www.kaggle.com/competitions/czii-cryo-et-object-identification). The general premise is that you can recover object localization via local maxima from predicted blobs.\n\n#### How we used nnU-Net for regression\nnnU-Net is built for semantic segmentation. This also includes its expected data structure. To make it compatible with motor regression we store the ground truth as instance segmentation maps where each motor is encoded with a sphere (r=6 pixels) with a unique integer label. These spheres are treated by nnU-Net as segmentations and are passed through the data loading and augmentation pipeline as nnU-Net normally would, thus properly applying rotations, mirroring etc. At the end of the dataloading pipeline we inject a custom transform that converts each motor instance into a blob. Blobs are injected via a pixelwise max operator to properly allow for motors in close proximity.\n\n#### Blob generation\nWe use ‘EDT blobs’, basically 3D spheres that were transformed using the euclidean distance transform and rescaled to have a value range of [0, 1]. EDT spheres have a sharper ‘center’ than Gaussians. We also experimented with Gaussians and got very similar results. More experimentation would be needed to give a definitive answer on which one is better.\n\nOur spheres have a radius of 25 pixels. This eases learning as the imbalance in the target tensors (dominated by 0’s) is lessened. We also got very good results with r=15. Again, we didn’t have enough time to experiment intensively.\n\nHere are two examples for generated ETD blobs:\n\n\n\n\n#### Loss function\nAs reported by others, MSE and soft Dice loss didn’t perform well on this task. We used binary cross-entropy loss computed only on the 20% worst voxels (the ones with the highest loss value, computed over the entire batch). This gave a small bump relative to regular BCE in early experiments as it counteracts the imbalance in the targets. Focal loss did not yield improvements over TopK20 BCE.\n\n### Hyperparameters\nOur final model was trained with a batch size of 16 and a patch size of (128, 256, 256). Initial learning rate is 0.01 and is decayed over the course of the training using polyLR schedule (same as default nnU-Net). We train with SGD for 3500 epochs, where each epoch is defined as 250 iterations. Thus, our model is trained for 3500*250=875,000 steps and has seen 3500*250*16 = 14,000,000 patches.\n\n### Patch sampling strategy\nWe leverage nnU-Net’s default strategy, which synergizes well with the instance segmentation internal representation used here. The sampling strategy is as follows:\n- For 67% of the samples in the batch:\n - Pick a random training case\n - Pick a random patch from that case\n- For the remaining 33% (min 1 sample per batch!)\n - Pick a random training case\n - If this case has any motors:\n - Pick a random motor instance\n - Pick a patch that encompasses this motor\n - If no motor is present, fall back to random sampling\n\n### Data augmentation\nWe apply heavy data augmentation during training, including:\n- Random intensity clipping (10%)\n- Rotation and Scaling (30% each)\n- Rot90 (50%)\n- Transpose compatible axes (axes of same shape = the two 256 axes, see patch size, 50%)\n- OneOf(MedianFilter (10%), GaussianBlur (10%))\n- Gaussian Noise (15%)\n- Additive Brightness (5%)\n- OneOf(Contrast (15%), Multiplicative Brightness (15%))\n- Simulate low Resolution (7.5%)\n- Gamma (20%)\n- Gamma (inverted image) (20%)\n- Mirroring (50% for each axis, can mirror multiple axes)\n- Additive Brightness Gradient (10%)\n- Local Gamma Gradient (10%)\n- Sharpening (10%)\n- Image inversion (10%)\n\nWe refer to our [code defining the transforms](https://github.com/MIC-DKFZ/kaggle_BYU_Locating_Bacterial-Flagellar_Motors_2025_solution/blob/eafb1dfefccba71d629a64fc6619207d25197c42/nnunetv2/training/nnUNetTrainer/project_specific/kaggle2025_byu/data_augmentation/more_DA.py#L90) for further details, it’s too much (and not significant enough) to put all in here.\n\n### Dataloading Infrastructure\nOthers report issues with loading and augmenting tomograms on the fly. We observed no such issues thanks to [batchgeneratorsv2](https://github.com/MIC-DKFZ/batchgeneratorsv2) fast augmentation implementations and nnU-Net’s efficient data infrastructure. We use [blosc2](https://github.com/Blosc/python-blosc2) as a data format which allows partial reading from compressed files, enabling us to read only the part of the tomograms needed for the current patch. Moreover, by using reads via memmap, we can effectively cache some reads in RAM (done automatically via the OS) and therefore cut down on network bandwidth when reading data from a network drive. Data loading and augmentation is done on the CPU.\n\n### Compute Requirements\nOur final model was trained on 8xA100 40GB using PyTorch's DDP. Training took a bit less than 7 days. Note that we only scaled compute at the very end. Our best model with less compute scored 0.86392 (private lb) and trained in ~18h on a single A100. Note that comparison is not ideal, as we spent much less time optimizing thresholds for the smaller model.\n\n### Threshold tuning\nWhen running internal cross-validation we compute all motor detections and can then sweep for optimal threshold efficiently, allowing a comparison of models at their respective sweet spot and determining the threshold stability. After switching to the leaderboard for model optimization, we spend 5-10 submissions per model to determine the optimal threshold without following a systematic strategy. We did not do percentile thresholding and in hindsight, maybe should have, to be more efficient with submissions.\nFor our final model, 0.15 was ideal for the public (0.86734) and private (0.87656) leaderboard. The ‘low’ threshold value is related to the use of EDT instead of Gaussian blobs.\n\n## Inference\nWe largely use nnU-Net’s inference infrastructure. Tomograms are dissected into a series of overlapping patches (50% overlap) and predictions are stitched together by weighting the central pixels of the currently predicted patch higher than the borders (Gaussian importance weighting). Test time augmentation is applied by mirroring along all axes. Predicted logits are clamped to [0, 1] by applying a sigmoid, followed by motor detection.\nWe used the 2xT4 instances for the prediction and split the workload evenly between the two GPUs. We always use a single model, no ensembling. Inference takes 7-8 hours.\n\n### Postprocessing\n\n#### Cross-validation\nPredicted blobs are converted into motor predictions by performing non-maximum suppression. During cross-validation we need to allow for multiple motor detections per tomogram. We blur the predicted blobs with a 3D Gaussian (optional). We then detect motors as `motors = torch.argwhere((prediction == max_pool(prediction, kernel_size=min_motor_distance)) & (prediction > threshold))`.\n\n#### Leaderboard\nThe leaderboard only has tomograms with 0 or 1 motor, allowing us to simplify the inference logic. We simply find the maximum intensity in the prediction and check whether it is above the motor detection threshold.\n\n## Results\nOur model (single checkpoint, no ensembling) achieved a public score of 0.86734 and a private score of 0.87656. This ties our solution with Bartley. Unfortunately for us, Kaggle resolves ties by submission date, thus granting Bartley the (admittedly very well-deserved) 1st place. It takes quite some courage to make the last submission 9 days before the deadline. Kudos for that!\n\nWe would very much like to provide proper ablations for the different design choices made for our final submission, but feel like this would only be misleading as we did not provide equal threshold tuning budget to all models and do not have checkpoints for proper 1:1 comparisons of identical models for interesting testing scenarios. That said (and please take it with a big grain of salt), here are some anchors (private scores, reporting best submission that fits the description):\n\n**Data**\n\nLow compute (1xA100 40GB, 18h training) comparisons\n- Uncorrected official: N/A (sorry)\n- Uncorrected official + bartleys data: 0.83181\n- Corrected official + bartleys data: 0.86253\n- Corrected official + bartleys data and 555 additional cases: 0.86392 (probably lower than it should be due to insufficient threshold optimization!)\n\n=> Correcting the GT seems to have had a big impact. Effect of additional data unclear\nHigh compute comparison makes no sense here as there are insufficient samples and results are all over the place.\n\n**Gaussian vs EDT blobs**\n\nLow compute (1xA100 40GB, 18h training) comparisons, using corrected official + bartleys data\n- Best EDT: 0.84888 (r=25)\n- Best Gaussian: 0.84513 (r=15)\n\nFor everything else we have insufficient data points, too unbalanced threshold tuning budgets or experimental configurations that diverge too much. \n\n## What did not work?\nWhile we were convinced that blob regression was the ideal task formulation we wanted to be doubly sure by trying other task formulations as well:\n- 3D Segmentation with postprocessing (also nnU-Net)\n- YOLO-based 2D detection\n- [nnDetection](https://github.com/MIC-DKFZ/nnDetection)-based 3D detection\n- Landmark detection with [nnLandmark](https://arxiv.org/abs/2504.06742) (also does blob regression but uses MSE loss)\n\nNone of these came close to the nnU-Net based blob regression performance in initial experiments and were quickly discontinued. Note that each of these solutions might have been optimized further to achieve competitive performance - we just didn’t invest more time and just tried them out of the box.\n\nOther loss formulations like soft Dice, focal loss, MSE did not help. Standard BCE was similar in performance as the TopK variant we used here.\n\nWe experimented with FP oversampling by increasing the likelihood of sampling patches where our previous model iteration generated FP motor predictions. This led to roughly equivalent performance and was discarded due to additional complexity.\n\n## What else should we have done?\nWe joined late and didn’t devote enough time early, so we were under time pressure at the end and were greatly constricted by the submission limit. We definitely should have started sooner and made more systematic use of the submissions.\n\nQuantile thresholding was reported by others to have been a good solution to overcome threshold optimization needs on the lb. We should have done that.\n\nWe did not invest sufficient time in ensembling, leading to our final model to be a single checkpoint. There is likely some performance improvement to be had from using ensembling. Doing this effectively would have required us to train smaller/faster models and carefully balance ensembling with TTA and patch overlap in inference, so it’s not something we could have done overnight.\n\n## What would we have wished for?\nTo this day, we still don’t know what leads to the performance difference between internal CV and the leaderboard. We suspect there may be a distribution shift, for example, a different overall number of motors, different species of bacteria, or different scanners. It felt quite frustrating having to rely on the leaderboard so much. It would have been nice to have a training dataset that allows for meaningful internal validation so that we can test more ideas and are less constrained by the 5 submissions per day. So, essentially a training dataset that is more representative of the expected target distribution.\n\nWe found it somewhat limiting to work with uint8-quantized intensities for a modality that typically operates in float32 (or occasionally uint16). It was also unclear what additional preprocessing steps (e.g., intensity clipping or normalization) were applied by the organizers, which introduced a degree of guesswork when integrating external data. While we understand this choice was likely made to be more inclusive to participants from the computer vision community, it felt like driving with the handbrake on. Providing full-precision data along with a conversion script to jpg/png would have offered the best of both worlds.\n\nResizing to a common voxel spacing is a standard procedure in 3D images such as tomograms and would have been good to do here. We are wondering why voxel spacing information was not provided in the test set.\n\nThere seem to be [known errors in the training and test dataset](https://www.kaggle.com/competitions/byu-locating-bacterial-flagellar-motors-2025/discussion/582948) which were not corrected by the organizers. While we understand that this would have upset some participants, we believe it would have been better to update the annotations, especially on the private test dataset to make sure we measure algorithm performance accurately.\n\n## Acknowledgements\nWe thank BYU, especially Andrew Darley, for organizing and Kaggle for hosting this competition. We also want to thank Bartley, again, for generously sharing his data in an environment where he ran the risk that someone could use it to outperform his solution — that was a brave move. We furthermore want to give a shoutout to our Divisions of Medical Image Computing and Intelligent Medical Systems at the German Cancer Research Center (DKFZ) and to Helmholtz Imaging for being awesome. We also thank Lars Krämer for his excellent [napari data inspection tool](https://github.com/MIC-DKFZ/napari-data-inspection), which made manually inspecting motor annotations a breeze. Finally, a big thanks to the team — it was just an amazing experience to work on this competition together!\n\n## Resources\nSubmission Notebook: