{"cells":[{"metadata":{},"cell_type":"markdown","source":"# Create your own app using ipywidgets\n \n
\n
\n","execution_count":null},{"metadata":{},"cell_type":"markdown","source":"Here's an working example of the App.\n\n ","execution_count":null},{"metadata":{},"cell_type":"markdown","source":"# 1. Libraries Required\nGo back to the Table of Contents\n\nLet's first install all the libraries required for the application.","execution_count":null},{"metadata":{"_kg_hide-output":true,"trusted":true},"cell_type":"code","source":"!pip install pydub","execution_count":null,"outputs":[]},{"metadata":{"_uuid":"d629ff2d2480ee46fbb7e2d37f6b5fab8052498a","_cell_guid":"79c7e3d0-c299-4dcb-8224-4455121ee9b0","trusted":true},"cell_type":"code","source":"#Libraries Required\nimport pandas as pd\nimport numpy as np\nimport plotly.graph_objects as go\nimport os\nimport requests\nimport re\nimport IPython.display as ipd\nfrom pydub import AudioSegment\nimport requests\nimport json\nfrom bs4 import BeautifulSoup\nimport ipywidgets as widgets","execution_count":null,"outputs":[]},{"metadata":{},"cell_type":"markdown","source":"# 2. Gathering Data\nGo back to the Table of Contents\n\nI am using the [public dataset](https://www.kaggle.com/anshuls235/birdsongrecognitiondetails) uploaded by me directly.\n\nBut, if you want to know the code to get the bird details refer to the below commented code. I have scrapped these details using beautiful soup and requests library. The webpage from where I have scraped the data is https://ebird.org/species.","execution_count":null},{"metadata":{"_kg_hide-output":true,"trusted":true},"cell_type":"code","source":"\"\"\"\ndic_bird = {} \nfor code in df_train.ebird_code.unique():\n if code not in dic_bird:\n url = 'https://ebird.org/species/'+code\n r = requests.get(url)\n soup = BeautifulSoup(r.content, 'html.parser')\n desc = soup.find('meta',property=\"og:description\")\n image = soup.find('meta',property=\"og:image\")\n dic_bird[code]={}\n dic_bird[code]['description'] = desc['content']\n dic_bird[code]['image'] = image['content']\n#Convert the dictionary to dataframe.\ndf = pd.DataFrame(columns=['species','description','image'])\ni = 0\nfor key,val in dic_bird.items():\n df.loc[i,'species'] = key\n df.loc[i,'description'] = val['description']\n df.loc[i,'image'] = val['image']\n i+=1\ndf.to_csv('bird_details.csv',index=False)\n\"\"\"","execution_count":null,"outputs":[]},{"metadata":{},"cell_type":"markdown","source":"As can be seen from the code, to get the details of a particular species of the bird we need to append its `ebird_code` to the site URL.","execution_count":null},{"metadata":{"trusted":true},"cell_type":"code","source":"#Get the training data and the dataset containing images & descriptions\ndf_train = pd.read_csv('/kaggle/input/birdsong-recognition/train.csv')\ndf = pd.read_csv('/kaggle/input/birdsongrecognitiondetails/bird_details.csv')\nmedia_path = '/kaggle/input/birdsong-recognition/train_audio/'","execution_count":null,"outputs":[]},{"metadata":{},"cell_type":"markdown","source":"# 3. Designing the Components\nGo back to the Table of Contents\n\nAfter collecting all the data, the next logical step is to create the components of the app one by one. I’ll be listing down the steps for all components one by one in sequence.","execution_count":null},{"metadata":{},"cell_type":"markdown","source":"## 3.1 Species, Recordist & Audio options\n
 \n\nThis is an example of how it will look. The user can easily scroll through all the options easily. Also, the values of recordists and filename change on the basis of the species selected. This will be covered in the interactions section later. The code to implement this is as follows:","execution_count":null},{"metadata":{"trusted":true},"cell_type":"code","source":"# Dictionary to Store Default values\ndefault_values = {\n 'species': 'Alder Flycatcher',\n 'recordist': 'Jonathon Jongsma',\n 'audio': 'XC134874.mp3',\n 'image': df.loc[df['species']=='aldfly','image'].tolist()[0],\n 'text': df.loc[df['species']=='aldfly','description'].tolist()[0],\n 'filename': os.path.join('/kaggle/input/birdsong-recognition/train_audio/','aldfly','XC134874.mp3'),\n 'latitude': 44.793,\n 'longitude': -92.962,\n 'location': 'Grey Cloud Dunes SNA, Washington, Minnesota'\n}\n\ndef get_recordist_options(species):\n \"\"\"Getter method for Recordist values.\"\"\"\n return df_train[df_train['species']==species]['author'].unique().tolist()\n\ndef get_audio_options(species,recordist):\n \"\"\"Getter method for Audio file values.\"\"\"\n return df_train[(df_train['species']==species)&(df_train['author']==recordist)]['filename'].unique().tolist()\n\nspecies = widgets.Dropdown(\n description = 'Species: ',\n value = default_values['species'],\n options = df_train['species'].unique().tolist(),\n layout=dict(width='233px')\n)\n\nrecordists = widgets.Dropdown(\n description = 'Recordist: ',\n value = default_values['recordist'],\n options = get_recordist_options(default_values['species']),\n layout=dict(width='233px')\n)\n\naudios = widgets.Dropdown(\n description = 'Filename: ',\n value = default_values['audio'],\n options = get_audio_options(default_values['species'],default_values['recordist']),\n layout=dict(width='233px')\n)\ncontainer1 = widgets.HBox(children=[species, recordists, audios])\ncontainer1","execution_count":null,"outputs":[]},{"metadata":{},"cell_type":"markdown","source":"## 3.2 Title + Audio Container\nGo back to the Table of Contents\n\n
 \nThe title can be easily added using the HTML widgets. It changes depending on the species selected. The audio is shown using the Audio widget.","execution_count":null},{"metadata":{"trusted":true},"cell_type":"code","source":"title = widgets.HTML('
{}
'.format(default_values['species']),layout=dict(width='350px'))\nout = widgets.Output(layout=dict(width='350px',margin='10px 0px 0px 0px'))\nout.append_display_data(ipd.Audio(default_values['filename']))\ncontainer2 = widgets.HBox(children=[title,out])\ncontainer2","execution_count":null,"outputs":[]},{"metadata":{},"cell_type":"markdown","source":"## 3.3 Image + Description Container\nGo back to the Table of Contents\n\n \nI have added image and description using the HTML widget. Later, both are pooled into a Horizontal Box container using HBox widget. Also, layout can be defined for each widget separately. This is exactly similar to CSS.","execution_count":null},{"metadata":{"trusted":true},"cell_type":"code","source":"im = widgets.HTML('
 '.format(default_values['image']),\n layout=dict(height='250px',width='300px'))\ntext = widgets.HTML('
{}
'.format(default_values['text']),\n layout=dict(height='250px',width='400px',margin='10px 0px 0px 10px'))\ncontainer3 = widgets.HBox(children=[im,text])\ncontainer3","execution_count":null,"outputs":[]},{"metadata":{},"cell_type":"markdown","source":"## 3.4 Statistics about birds\nGo back to the Table of Contents\n\n \nAvg. Rating is the mean rating of all the ratings for short recordings of bird’s species calls generously uploaded by users of xenocanto.org. Average duration is the mean duration of the bird calls. Average elevation as the name suggests is the mean height the bird travels at.\n
\nElevation is provided to us in a string format with lot of variations. In the below code block I've added the function to derive the elevation of the bird.","execution_count":null},{"metadata":{"trusted":true},"cell_type":"code","source":"def get_elevation(val):\n \"\"\"Derive the elevation value from the string. Also, I have \n kept negative elevation values as below sea level is also a possibility.\"\"\"\n l = re.findall('[~\\?]?(-?\\d+[\\.,]?\\d*)-?(\\d*)',val)\n val1=0\n val2=0\n if l:\n if l[0][0]:\n val1=float(l[0][0].replace(',',''))\n if l[0][1]:\n val2=float(l[0][1].replace(',',''))\n if val1!=0 and val2!=0:\n return (val1+val2)/2\n return val1\n else:\n return float('nan')\ndf_train.elevation=df_train.elevation.apply(lambda x: get_elevation(x))\n\ndef get_stats(species):\n \"\"\"Get the Average rating,Duration of chip &\n elevation of the bird species.\"\"\"\n df_sp = df_train[df_train['species']==species]\n avg_rating = np.round(df_sp.rating.mean(),2)\n avg_duration = np.round(df_sp.duration.mean(),2)\n avg_elevation = np.round(df_sp.elevation.mean(),2)\n return avg_rating,avg_duration,avg_elevation\n\nr,d,e = get_stats(default_values['species'])\nrating = widgets.HTML('Avg. Rating
{}
'.format(r),layout=dict(width='233px'))\nduration = widgets.HTML('Avg. Duration
{} s
'.format(d),layout=dict(width='233px'))\nelevation = widgets.HTML('Avg. Elevation
{} m
'.format(e),layout=dict(width='233px'))\ncontainer4 = widgets.HBox(children=[rating,duration,elevation])\ncontainer4","execution_count":null,"outputs":[]},{"metadata":{},"cell_type":"markdown","source":"## 3.5 Waveform Plot\nGo back to the Table of Contents\n\n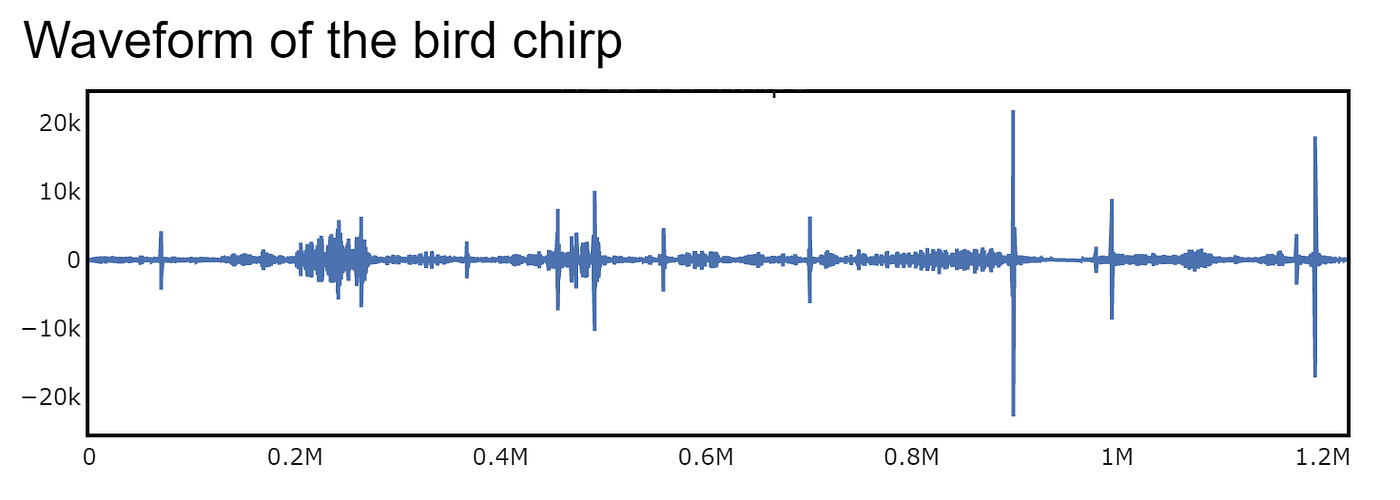 \nTo show bird chirp graphically I'll be using a waveform plot. I have used a helper function to convert mp3 to NumPy array and then used Plolty FigureWidget to create the waveform plot. Simple matplotlib plots can be used as well but I always prefer Plotly owing to its added interactivity. The waveform changes on the basis of the audio file selected.\n\nThe audios in our dataset can be mono or stereo. So, we need to take care of the number of channels. I have used plotly's [FigureWidget](https://plotly.com/python/figurewidget/) as it works pretty well with ipywidgets. ","execution_count":null},{"metadata":{"trusted":true},"cell_type":"code","source":"def read(f, normalized=False):\n \"\"\"Converts MP3 to numpy array\"\"\"\n a = AudioSegment.from_mp3(f)\n y = np.array(a.get_array_of_samples())\n if a.channels == 2:\n y = y.reshape((-1, 2))\n if normalized:\n return a.frame_rate, np.float32(y) / 2**15\n else:\n return a.frame_rate, y\n\ndef plot_waveform(arr,filename):\n \"\"\"Plots the waveform from the numpy array\"\"\"\n fig = go.FigureWidget()\n try:\n channels = arr.shape[1]\n for channel in range(channels):\n fig.add_trace(go.Scatter(name='channel '+str(channel+1),y=arr[:,channel]))\n except IndexError:\n fig.add_trace(go.Scatter(y=arr,showlegend=False))\n fig.update_layout(template='seaborn',plot_bgcolor='rgb(255,255,255)',paper_bgcolor='rgb(255,255,255)',\n height = 200, width = 700,title=filename,legend=dict(x=0.3,y=1.3,orientation='h'),\n xaxis=dict(mirror=True,linewidth=2,linecolor='black'),\n yaxis=dict(mirror=True,linewidth=2,linecolor='black'),\n margin=dict(l=0,r=0,t=0,b=5))\n return fig\n \nrate, arr = read(default_values['filename'])\ntitle_g = widgets.HTML('
Waveform of the bird chirp
')\ng = plot_waveform(arr,default_values['filename'].split('/')[-1])","execution_count":null,"outputs":[]},{"metadata":{},"cell_type":"markdown","source":"## 3.6 Map plot\nGo back to the Table of Contents\n\n \nI have used Plotly’s scattermapbox to plot the recording location on the map. It also changes depending on the audio file selected.\nTo plot the location on map, where a particular recording was made, we would require the below method. It takes in the latitude, longitude and the location from the train dataset and plots it on a mapbox plot.\n> **Please Note:** The dimensions of the plot are as per the app. So, you can change it acoordingly in the function.","execution_count":null},{"metadata":{"trusted":true},"cell_type":"code","source":"#get the mapbox token\nfrom kaggle_secrets import UserSecretsClient\nuser_secrets = UserSecretsClient()\nsecret_value_1 = user_secrets.get_secret(\"mapboxtoken\")\n\ndef plot_location(lat,lon,location):\n \"\"\"Plots the recording location on the map.\"\"\"\n trace = go.Scattermapbox(lon=[lon],lat=[lat],hovertext=location,\n marker=dict(symbol='campsite',size=20,color='blue'))\n data = [trace]\n layout = go.Layout(\n width=700,\n height=200,\n margin=dict(l=0,r=0,t=5,b=0),\n hovermode='closest',\n mapbox=dict(\n accesstoken=secret_value_1,\n bearing=0,\n style='satellite-streets',\n center=go.layout.mapbox.Center(\n lat=lat,\n lon=lon\n ),\n pitch=0,\n zoom=10\n )\n )\n figure = go.Figure(data=data, layout=layout)\n fig = go.FigureWidget(figure)\n return fig\n\ntitle_map = widgets.HTML('
Where the recording was made?
')\nloc_map = plot_location(default_values['latitude'],default_values['longitude'],default_values['location']) ","execution_count":null,"outputs":[]},{"metadata":{},"cell_type":"markdown","source":"**Please note:** In case you are using plotly for your plots, all the plots should be added to the plotly.graph_objects.Figurewidget for ipywidgets to work properly with them.","execution_count":null},{"metadata":{},"cell_type":"markdown","source":"## 3.7 Combining all Components\nGo back to the Table of Contents\n\nAfter designing all the components, just pool them into a single component.","execution_count":null},{"metadata":{"trusted":true},"cell_type":"code","source":"app = widgets.VBox(children=[container1,container2,container3,container4,title_g,g,title_map,loc_map])","execution_count":null,"outputs":[]},{"metadata":{},"cell_type":"markdown","source":"# 4. App Interactions\nGo back to the Table of Contents\n\nFollowing all the steps in section 2 will produce a static app. But, Nobody likes a static app! So, to add interactions to our ipywidgets app we need to add callback functions which will take care of changing the data of the components we designed. The following are the interactions which take place in the app:\n- `change species`-> change recordists dropdown, change audios dropdown, change title, image & text, and change bird stats.\n- `change recordist`-> change audios dropdown.\n- `change audio`-> change waveform and recording location map.\n\nI have kept separate callbacks to stick to the flow listed above. Please note when `response_sp()` callback is triggered it will automatically trigger `response_re()` and `response_au()` callbacks respectively as recordists and audio values are changing in the species change callback function.\nSimilarly, `response_re()` will trigger `response_au()`. And `response_au()` alone won’t trigger any callbacks.","execution_count":null},{"metadata":{"trusted":true},"cell_type":"code","source":"def get_filename(ebird_code,file):\n \"\"\"Getter method for filename.\"\"\"\n return os.path.join('/kaggle/input/birdsong-recognition/train_audio/',ebird_code,file)\n\ndef get_ebird_code(species):\n \"\"\"Getter method for ebird_code.\"\"\"\n return df_train.loc[df_train['species']==species,'ebird_code'].tolist()[0]\n\ndef get_image(ebird_code):\n \"\"\"Getter method for image URL.\"\"\"\n return df.loc[df['species']==ebird_code,'image'].tolist()[0]\n\ndef get_text(ebird_code):\n \"\"\"Getter method for species description.\"\"\"\n return df.loc[df['species']==ebird_code,'description'].tolist()[0]\n\ndef response_sp(change):\n \"\"\"callback function for species dropdown\"\"\"\n ecode = get_ebird_code(species.value)\n \n #change recordists dropdown\n options = get_recordist_options(species.value)\n recordists.options = options\n recordists.value = options[0]\n \n #change filename dropdown\n options = get_audio_options(species.value,recordists.value)\n audios.options = options\n audios.value = options[0]\n \n #change title, image and text\n title.value = '{}
'.format(species.value)\n im.value = ''.format(get_image(ecode))\n text.value = '{}
'.format(get_text(ecode))\n \n #change bird stats\n r,d,e = get_stats(species.value)\n rating.value = 'Avg. Rating
{}
'.format(r)\n duration.value = 'Avg. Duration
{} s
'.format(d)\n elevation.value = 'Avg. Elevation
{} m
'.format(e)\n\ndef response_re(change):\n \"\"\"callback function for recordists dropdown.\"\"\"\n #change audios dropdown\n options = get_audio_options(species.value,recordists.value)\n audios.options = options\n audios.value = options[0]\n\ndef response_au(change):\n \"\"\"callback function for audios dropdown.\"\"\"\n ecode = get_ebird_code(species.value)\n file = audios.value\n filename = get_filename(ecode,file)\n with out:\n ipd.clear_output()\n ipd.display(ipd.Audio(filename))\n rate, arr = read(filename)\n g_new = plot_waveform(arr,filename.split('/')[-1])\n g.update(data=g_new.data,layout=g_new.layout)\n lat = df_train.loc[df_train['filename']==audios.value,'latitude'].tolist()[0]\n lon = df_train.loc[df_train['filename']==audios.value,'longitude'].tolist()[0]\n location = df_train.loc[df_train['filename']==audios.value,'location'].tolist()[0]\n loc_map_new = plot_location(float(lat),float(lon),location)\n loc_map.update(data=loc_map_new.data,layout=loc_map_new.layout)\n\n#Definition of callbacks \nspecies.observe(response_sp, names=\"value\")\nrecordists.observe(response_re, names=\"value\")\naudios.observe(response_au, names=\"value\")","execution_count":null,"outputs":[]},{"metadata":{},"cell_type":"markdown","source":"### Finally the app is complete!\nJust run the below code cell now to see the entire app in action.(Provided you have executed all the steps above.)","execution_count":null},{"metadata":{"trusted":true},"cell_type":"code","source":"#Run the App!\napp","execution_count":null,"outputs":[]},{"metadata":{},"cell_type":"markdown","source":"### It's dissapointing that kaggle notebooks don't support ipywidgets currently(On commit only). If you fork the kernel and then execute the app it will run successfully and you play around. But, doesn't work on commit. Hopefully the Kaggle team addresses this issue.","execution_count":null},{"metadata":{},"cell_type":"markdown","source":"# Thanks for reading this far. Do leave an upvote in case you liked my work. It motivates me to produce more quality content.\n### All the steps along with explanations are also available in my [medium article](https://medium.com/analytics-vidhya/diy-interactive-app-just-using-python-55134429bf35).\n### [Click here](https://www.kaggle.com/anshuls235/notebooks) to view my other kernels.\n ","execution_count":null}],"metadata":{"kernelspec":{"language":"python","display_name":"Python 3","name":"python3"},"language_info":{"pygments_lexer":"ipython3","nbconvert_exporter":"python","version":"3.6.4","file_extension":".py","codemirror_mode":{"name":"ipython","version":3},"name":"python","mimetype":"text/x-python"}},"nbformat":4,"nbformat_minor":4}