
Thanks a lot to the host and Kaggle for this very interesting competition. We learned a lot and specifically the issue of predicting unseen graphemes in test data was very intriguing and has led to some very elegant and nice solutions as imminent from all the other solution posts. As always, this has been an incredible Zoo team effort and always amazing to collaborate with @dott1718.
\n\nWe will try to tell the story of progress a bit, without only explaining the end solution as we believe that the whole process of a competition is important to understand how decisions have been made.
\n\nWe started the competition by fitting 3-head models for R,C,V and quite quickly got reasonable results landing us somewhere in range of top 40-50 on LB. As always, we tried to understand how test data can be different, and why there is a gap to local CV. It became quite quickly clear to us that it is mostly due to unseen graphemes in test. We tried to assess how such a gap can exist, and checked how R, C and V scored individually on LB (you can figure this out quite easily by predicting all 0s for the rest, which is baseline sub). We saw that most drop comes from R and C, which is impacted by the huge effect of rare case misclassifications. So we tried something funny, which is adding additional C=3 and C=6 predictions based on the next highest indices. Just adding 310 C=3 and 310 C=6 (which reflects one extra grapheme for each) boosted us 30-40 points on LB. So we figured that this will be key in the end, and we need to generate a solution that generalizes well to unseen ones. We did also not want to rely on hardcoding too much, so tried to find a better way. These early subs with no blending at all, but this simple hardcoding, would btw still be rank 10-20 now.
\n\nSeeing reported CV scores on forums, which were all quite higher than ours, made us think that top teams are doing something different than us, which apparently was different targets. So our, first trick was to switch from predicting R,C,V to predicting individual graphemes. This also had benefits to us for not needing to care about proper loss weights of the 3 heads, different learning weights for the heads, how to deal with soft labels properly, and we could focus fully on NN fitting and augmentations. After we switched, mixing augmentations shined immediately - we replaced cutout with cutmix and then with fmix, which made it to the final models we had. Fmix (https://arxiv.org/abs/2002.12047) worked clearly better for us than cutmix, and also the resulting images looked way more natural to us due to the way the cut areas are picked. This is an example of a mixed image:
\n\n
In the end, we mixed either 2 images or 3 images with 50% probability and used beta=4 to mostly do equal mixing.
\n\nHaving this grapheme model, the tricky part was to apply the model to test. At first, we tried applying the model as it is, so predicting only the known graphemes by just converting the predicted grapheme to its R,C,V components. LB score was better than for the model predicting R,C,V separately, which tells us there are not that many new unseen graphemes in public LB. To make the model work better on unseen graphemes, we applied the second trick - a post-processing routine. Surprisingly, it also improved the metric on the known graphemes as well.
\n\nThe model outputs 1295 probabilities of each distinct train grapheme. For each component, e.g. C, we calculate the scores of each C=0,..,6 by averaging probabilities of the graphemes having this component. So, for C=3 it is an average of only 4 probabilities as there are only 4 graphemes with consonant diacritic of 3 in train data. For C=0 it is an average of hundreds of probabilities as it is the most common C value. The post-processing ends with picking C value with the highest “score”. The logic behind it was to treat each C value equally regardless of its frequency similar to the target metric, not to limit the model to the set of train graphemes, and pick more likely component values for the graphemes with non-confident predictions. This routine immediately gave us another 50 extra points on LB.
\n\nThe third trick was about improving the predictions of unseen graphemes without hurting predictions of known graphemes too much. As most of you probably know and as elaborated earlier, the gap between cross-validation and public LB was coming from the drop of accuracy in the C component, caused mainly by C=3 and to lesser extent by C=6. It is easy to explain, as these are the rarest classes in train, and most probably public LB has at least one new grapheme with C=3 and C=6. The second largest drop was coming from the R component, while V recall was quite close between cross-validation and public LB.
\n\nThe main problem with both 3-head models and specifically grapheme models is that they overfit to the seen graphemes as they are heavily memorizing them. So to close the gap a bit, we needed models which predict R and C better on unseen graphemes, which led us to fitting individual models for these 2 components. Specifically for C it was very hard to generalize and what helped a bit was to randomly add generated graphemes based on the code we found in this kernel (kudos to the author!) https://www.kaggle.com/kaushal2896/bengali-graphemes-starter-eda-multi-output-cnn. But, as we learnt after the end of the competition, there was way more room to improve the models this way than we actually did.
\n\nTrick number four was about how to blend the models together. To test the blending approaches, we recreated the hold-out sample by removing a few graphemes completely from the training part, also a couple of graphemes with C=3 and 6. We ended up doing different blending per component. But first, the models we had by the end of the competition are:\n- 3 grapheme models, fitted on the whole train. The modes use adam and sgd scheduling, fitted for 80 - 130 epochs and all use fmix mixing 2-3 images.\n- 1 model with 3-heads for all components. Cutout instead of fmix, sgd and 40 epochs, similar to all the following models\n- 1 model for R\n- 2 models for C
\n\nFor R the blend is: post-processed average of grapheme models + 0.4 * average of 3-heads model and R model
\n\nFor V the blend is: post-processed average of grapheme models + 0.2 * 3-heads model scaled to have equal means
\n\nFor C the blend is: post-processed average of grapheme models + 15 * average of C models * C class weights
\n\nC class weights were introduced to fix the imbalanced frequencies of C, especially C=3 and 6. They were set to inverse frequencies of the class in train and normalized.
\n\n6 out of 7 models are SE Resnext50 and one is SE Resnext101. Image size was either original or 224x224. Adam scheduling with decay worked well, but SGD with scaled down every X epochs was even better. Fmix was done on the entire sample, meaning that for each image there were 2 or 3 (random with prob=0.5) random images picked from the whole training sample and mixed.
\n\nHappy to try to answer any questions!
", "messages": [ { "id": 775706, "postDate": "2020-03-17T00:16:20.707Z", "content": "Thanks a lot to the host and Kaggle for this very interesting competition. We learned a lot and specifically the issue of predicting unseen graphemes in test data was very intriguing and has led to some very elegant and nice solutions as imminent from all the other solution posts. As always, this has been an incredible Zoo team effort and always amazing to collaborate with @dott1718.
\n\nWe will try to tell the story of progress a bit, without only explaining the end solution as we believe that the whole process of a competition is important to understand how decisions have been made.
\n\nWe started the competition by fitting 3-head models for R,C,V and quite quickly got reasonable results landing us somewhere in range of top 40-50 on LB. As always, we tried to understand how test data can be different, and why there is a gap to local CV. It became quite quickly clear to us that it is mostly due to unseen graphemes in test. We tried to assess how such a gap can exist, and checked how R, C and V scored individually on LB (you can figure this out quite easily by predicting all 0s for the rest, which is baseline sub). We saw that most drop comes from R and C, which is impacted by the huge effect of rare case misclassifications. So we tried something funny, which is adding additional C=3 and C=6 predictions based on the next highest indices. Just adding 310 C=3 and 310 C=6 (which reflects one extra grapheme for each) boosted us 30-40 points on LB. So we figured that this will be key in the end, and we need to generate a solution that generalizes well to unseen ones. We did also not want to rely on hardcoding too much, so tried to find a better way. These early subs with no blending at all, but this simple hardcoding, would btw still be rank 10-20 now.
\n\nSeeing reported CV scores on forums, which were all quite higher than ours, made us think that top teams are doing something different than us, which apparently was different targets. So our, first trick was to switch from predicting R,C,V to predicting individual graphemes. This also had benefits to us for not needing to care about proper loss weights of the 3 heads, different learning weights for the heads, how to deal with soft labels properly, and we could focus fully on NN fitting and augmentations. After we switched, mixing augmentations shined immediately - we replaced cutout with cutmix and then with fmix, which made it to the final models we had. Fmix (https://arxiv.org/abs/2002.12047) worked clearly better for us than cutmix, and also the resulting images looked way more natural to us due to the way the cut areas are picked. This is an example of a mixed image:
\n\n
In the end, we mixed either 2 images or 3 images with 50% probability and used beta=4 to mostly do equal mixing.
\n\nHaving this grapheme model, the tricky part was to apply the model to test. At first, we tried applying the model as it is, so predicting only the known graphemes by just converting the predicted grapheme to its R,C,V components. LB score was better than for the model predicting R,C,V separately, which tells us there are not that many new unseen graphemes in public LB. To make the model work better on unseen graphemes, we applied the second trick - a post-processing routine. Surprisingly, it also improved the metric on the known graphemes as well.
\n\nThe model outputs 1295 probabilities of each distinct train grapheme. For each component, e.g. C, we calculate the scores of each C=0,..,6 by averaging probabilities of the graphemes having this component. So, for C=3 it is an average of only 4 probabilities as there are only 4 graphemes with consonant diacritic of 3 in train data. For C=0 it is an average of hundreds of probabilities as it is the most common C value. The post-processing ends with picking C value with the highest “score”. The logic behind it was to treat each C value equally regardless of its frequency similar to the target metric, not to limit the model to the set of train graphemes, and pick more likely component values for the graphemes with non-confident predictions. This routine immediately gave us another 50 extra points on LB.
\n\nThe third trick was about improving the predictions of unseen graphemes without hurting predictions of known graphemes too much. As most of you probably know and as elaborated earlier, the gap between cross-validation and public LB was coming from the drop of accuracy in the C component, caused mainly by C=3 and to lesser extent by C=6. It is easy to explain, as these are the rarest classes in train, and most probably public LB has at least one new grapheme with C=3 and C=6. The second largest drop was coming from the R component, while V recall was quite close between cross-validation and public LB.
\n\nThe main problem with both 3-head models and specifically grapheme models is that they overfit to the seen graphemes as they are heavily memorizing them. So to close the gap a bit, we needed models which predict R and C better on unseen graphemes, which led us to fitting individual models for these 2 components. Specifically for C it was very hard to generalize and what helped a bit was to randomly add generated graphemes based on the code we found in this kernel (kudos to the author!) https://www.kaggle.com/kaushal2896/bengali-graphemes-starter-eda-multi-output-cnn. But, as we learnt after the end of the competition, there was way more room to improve the models this way than we actually did.
\n\nTrick number four was about how to blend the models together. To test the blending approaches, we recreated the hold-out sample by removing a few graphemes completely from the training part, also a couple of graphemes with C=3 and 6. We ended up doing different blending per component. But first, the models we had by the end of the competition are:\n- 3 grapheme models, fitted on the whole train. The modes use adam and sgd scheduling, fitted for 80 - 130 epochs and all use fmix mixing 2-3 images.\n- 1 model with 3-heads for all components. Cutout instead of fmix, sgd and 40 epochs, similar to all the following models\n- 1 model for R\n- 2 models for C
\n\nFor R the blend is: post-processed average of grapheme models + 0.4 * average of 3-heads model and R model
\n\nFor V the blend is: post-processed average of grapheme models + 0.2 * 3-heads model scaled to have equal means
\n\nFor C the blend is: post-processed average of grapheme models + 15 * average of C models * C class weights
\n\nC class weights were introduced to fix the imbalanced frequencies of C, especially C=3 and 6. They were set to inverse frequencies of the class in train and normalized.
\n\n6 out of 7 models are SE Resnext50 and one is SE Resnext101. Image size was either original or 224x224. Adam scheduling with decay worked well, but SGD with scaled down every X epochs was even better. Fmix was done on the entire sample, meaning that for each image there were 2 or 3 (random with prob=0.5) random images picked from the whole training sample and mixed.
\n\nHappy to try to answer any questions!
", "rawMarkdown": "Thanks a lot to the host and Kaggle for this very interesting competition. We learned a lot and specifically the issue of predicting unseen graphemes in test data was very intriguing and has led to some very elegant and nice solutions as imminent from all the other solution posts. As always, this has been an incredible Zoo team effort and always amazing to collaborate with @dott1718.\n\nWe will try to tell the story of progress a bit, without only explaining the end solution as we believe that the whole process of a competition is important to understand how decisions have been made.\n\n### Early efforts\nWe started the competition by fitting 3-head models for R,C,V and quite quickly got reasonable results landing us somewhere in range of top 40-50 on LB. As always, we tried to understand how test data can be different, and why there is a gap to local CV. It became quite quickly clear to us that it is mostly due to unseen graphemes in test. We tried to assess how such a gap can exist, and checked how R, C and V scored individually on LB (you can figure this out quite easily by predicting all 0s for the rest, which is baseline sub). We saw that most drop comes from R and C, which is impacted by the huge effect of rare case misclassifications. So we tried something funny, which is adding additional C=3 and C=6 predictions based on the next highest indices. Just adding 310 C=3 and 310 C=6 (which reflects one extra grapheme for each) boosted us 30-40 points on LB. So we figured that this will be key in the end, and we need to generate a solution that generalizes well to unseen ones. We did also not want to rely on hardcoding too much, so tried to find a better way. These early subs with no blending at all, but this simple hardcoding, would btw still be rank 10-20 now.\n\n### Grapheme models and fitting\nSeeing reported CV scores on forums, which were all quite higher than ours, made us think that top teams are doing something different than us, which apparently was different targets. So our, first trick was to switch from predicting R,C,V to predicting individual graphemes. This also had benefits to us for not needing to care about proper loss weights of the 3 heads, different learning weights for the heads, how to deal with soft labels properly, and we could focus fully on NN fitting and augmentations. After we switched, mixing augmentations shined immediately - we replaced cutout with cutmix and then with fmix, which made it to the final models we had. Fmix (https://arxiv.org/abs/2002.12047) worked clearly better for us than cutmix, and also the resulting images looked way more natural to us due to the way the cut areas are picked. This is an example of a mixed image:\n\n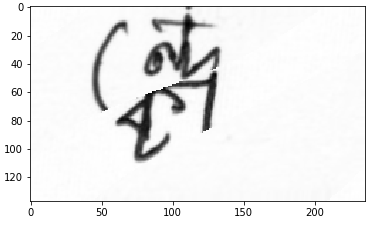\n\nIn the end, we mixed either 2 images or 3 images with 50% probability and used beta=4 to mostly do equal mixing. \n\nHaving this grapheme model, the tricky part was to apply the model to test. At first, we tried applying the model as it is, so predicting only the known graphemes by just converting the predicted grapheme to its R,C,V components. LB score was better than for the model predicting R,C,V separately, which tells us there are not that many new unseen graphemes in public LB. To make the model work better on unseen graphemes, we applied the second trick - a post-processing routine. Surprisingly, it also improved the metric on the known graphemes as well.\n\nThe model outputs 1295 probabilities of each distinct train grapheme. For each component, e.g. C, we calculate the scores of each C=0,..,6 by averaging probabilities of the graphemes having this component. So, for C=3 it is an average of only 4 probabilities as there are only 4 graphemes with consonant diacritic of 3 in train data. For C=0 it is an average of hundreds of probabilities as it is the most common C value. The post-processing ends with picking C value with the highest “score”. The logic behind it was to treat each C value equally regardless of its frequency similar to the target metric, not to limit the model to the set of train graphemes, and pick more likely component values for the graphemes with non-confident predictions. This routine immediately gave us another 50 extra points on LB.\n\n### Improving unseen graphemes\nThe third trick was about improving the predictions of unseen graphemes without hurting predictions of known graphemes too much. As most of you probably know and as elaborated earlier, the gap between cross-validation and public LB was coming from the drop of accuracy in the C component, caused mainly by C=3 and to lesser extent by C=6. It is easy to explain, as these are the rarest classes in train, and most probably public LB has at least one new grapheme with C=3 and C=6. The second largest drop was coming from the R component, while V recall was quite close between cross-validation and public LB.\n\nThe main problem with both 3-head models and specifically grapheme models is that they overfit to the seen graphemes as they are heavily memorizing them. So to close the gap a bit, we needed models which predict R and C better on unseen graphemes, which led us to fitting individual models for these 2 components. Specifically for C it was very hard to generalize and what helped a bit was to randomly add generated graphemes based on the code we found in this kernel (kudos to the author!) https://www.kaggle.com/kaushal2896/bengali-graphemes-starter-eda-multi-output-cnn. But, as we learnt after the end of the competition, there was way more room to improve the models this way than we actually did.\n\n### Blending \nTrick number four was about how to blend the models together. To test the blending approaches, we recreated the hold-out sample by removing a few graphemes completely from the training part, also a couple of graphemes with C=3 and 6. We ended up doing different blending per component. But first, the models we had by the end of the competition are:\n- 3 grapheme models, fitted on the whole train. The modes use adam and sgd scheduling, fitted for 80 - 130 epochs and all use fmix mixing 2-3 images.\n- 1 model with 3-heads for all components. Cutout instead of fmix, sgd and 40 epochs, similar to all the following models\n- 1 model for R\n- 2 models for C\n\nFor R the blend is: post-processed average of grapheme models + 0.4 * average of 3-heads model and R model\n\nFor V the blend is: post-processed average of grapheme models + 0.2 * 3-heads model scaled to have equal means\n\nFor C the blend is: post-processed average of grapheme models + 15 * average of C models * C class weights\n\nC class weights were introduced to fix the imbalanced frequencies of C, especially C=3 and 6. They were set to inverse frequencies of the class in train and normalized.\n\n6 out of 7 models are SE Resnext50 and one is SE Resnext101. Image size was either original or 224x224. Adam scheduling with decay worked well, but SGD with scaled down every X epochs was even better. Fmix was done on the entire sample, meaning that for each image there were 2 or 3 (random with prob=0.5) random images picked from the whole training sample and mixed. \n\nHappy to try to answer any questions!\n\n\n", "votes": 150 }, { "id": 786859, "postDate": "2020-03-26T09:24:18.093Z", "content": "This is the most interesting solution that I've read for this competition so far. I have read at least 50 solutions but the reason why I personally like this solution write up so much is because it conveys a story and the thinking. \nThat to me, is way more important than just seeing a solution which says \"try cutmix\" or \"use GANs to get synthetic data\".
\n\nI want to thank the authors for the win and also for this amazing write up, personally the learnings have come from reading this solution and I'll try to reimplement it, to learn even more. (Devil is in the details I think)
\n\nOnce again, thank you :)
", "rawMarkdown": "This is the most interesting solution that I've read for this competition so far. I have read at least 50 solutions but the reason why I personally like this solution write up so much is because it conveys a story and the thinking. \nThat to me, is way more important than just seeing a solution which says \"try cutmix\" or \"use GANs to get synthetic data\". \n\nI want to thank the authors for the win and also for this amazing write up, personally the learnings have come from reading this solution and I'll try to reimplement it, to learn even more. (Devil is in the details I think) \n\nOnce again, thank you :)", "votes": 7, "replies": [ { "id": 787150, "postDate": "2020-03-26T14:59:04.937Z", "content": "Thanks, happy if it helps :)
", "rawMarkdown": "Thanks, happy if it helps :)", "votes": 2 } ] }, { "id": 776672, "postDate": "2020-03-17T14:46:02.037Z", "content": "Updated the solution post!
", "rawMarkdown": "Updated the solution post!", "votes": 5 }, { "id": 775731, "postDate": "2020-03-17T00:33:00.847Z", "content": "congrats and nice work!
\n\ndoes it prove that GAN beats autoaugment (or other augment) here?
\n\nit is nice to see GAN being used and shown to improve results. This also means that the quality of kaggle solution has been brought to a new higher level.
", "rawMarkdown": "congrats and nice work!\n\ndoes it prove that GAN beats autoaugment (or other augment) here?\n\nit is nice to see GAN being used and shown to improve results. This also means that the quality of kaggle solution has been brought to a new higher level.\n", "votes": 6, "replies": [ { "id": 775749, "postDate": "2020-03-17T00:38:31.203Z", "content": "I dont know, it is honestly just a guess what top solution did. Hope we will learn.
", "rawMarkdown": "I dont know, it is honestly just a guess what top solution did. Hope we will learn." } ] }, { "id": 777592, "postDate": "2020-03-17T19:56:29.500Z", "content": "Congrats on another top gold cash finish. The Zoo is incredible!
\n\nGreat model. Your procedure of predicting one of 1295 graphemes and then choosing R, C, V component by averaging probabilities is great. That removes the biases of R, C, V class imbalances and does it in a more natural way than multiplying R, C, V probabilities by the inverse of their class frequency. Basically you assume a uniform distribution of graphemes and set the distribution of R, C, V based on that.
\n\nThanks for sharing Fmix, I didn't know about that, I'll check that out. The image you post does look more natural than CutMix. I used CAM CutMix which also did better than CutMix and looks more natural too.
\n\nWhat does \"30 points\" on LB mean?
", "rawMarkdown": "Congrats on another top gold cash finish. The Zoo is incredible!\n\nGreat model. Your procedure of predicting one of 1295 graphemes and then choosing R, C, V component by averaging probabilities is great. That removes the biases of R, C, V class imbalances and does it in a more natural way than multiplying R, C, V probabilities by the inverse of their class frequency. Basically you assume a uniform distribution of graphemes and set the distribution of R, C, V based on that.\n\nThanks for sharing Fmix, I didn't know about that, I'll check that out. The image you post does look more natural than CutMix. I used CAM CutMix which also did better than CutMix and looks more natural too.\n\nWhat does \"30 points\" on LB mean?", "votes": 3, "replies": [ { "id": 777621, "postDate": "2020-03-17T20:27:32.920Z", "content": "It is a cherry-picked image, but in general they look way more natural.
\n\n30 points means for example 9850 --> 9880
", "rawMarkdown": "It is a cherry-picked image, but in general they look way more natural. \n\n30 points means for example 9850 --> 9880", "votes": 1 } ] }, { "id": 775869, "postDate": "2020-03-17T02:07:32.667Z", "content": "congratulations, I couldn't agree more that models fitted on graphemes instead of R,C,V separately, I learned a lesson this time.
What you guys are doing is so different from us computer vision engineers. It seems that people who good at tabular data does think in a different way than the people who are mainly doing CV. I learned a lot from your post. Thanks!
", "rawMarkdown": "What you guys are doing is so different from us computer vision engineers. It seems that people who good at tabular data does think in a different way than the people who are mainly doing CV. I learned a lot from your post. Thanks!", "votes": 4, "replies": [ { "id": 778670, "postDate": "2020-03-18T16:24:08.513Z", "content": "This is a great point as we wanted to learn more about how different computer vision is to other types of tasks. I would say that nlp is quite similar to tabular data in many general aspects, but computer vision seems to require a different approach. It is still unclear to me how can you efficiently test ideas if a single fit of a model can take days. Not even talking about getting full 5-fold CV... I think we've learnt a lot during this month, but there is still a lot more to learn and, more importantly, more to adjust in line of thinking, approaching the task and building the modelling pipelines. But I am kinda happy it is a long learning curve, looking forward to gain more insights in \"computer vision engineer\" way of doing it!
", "rawMarkdown": "This is a great point as we wanted to learn more about how different computer vision is to other types of tasks. I would say that nlp is quite similar to tabular data in many general aspects, but computer vision seems to require a different approach. It is still unclear to me how can you efficiently test ideas if a single fit of a model can take days. Not even talking about getting full 5-fold CV... I think we've learnt a lot during this month, but there is still a lot more to learn and, more importantly, more to adjust in line of thinking, approaching the task and building the modelling pipelines. But I am kinda happy it is a long learning curve, looking forward to gain more insights in \"computer vision engineer\" way of doing it!", "votes": 7 }, { "id": 778683, "postDate": "2020-03-18T16:34:30.630Z", "content": "Yes. I would like to gain more insights of \"tabular data engineer\" in the future as well 👍 \nIn this competition an experiment usually won't taking a day, it takes less than 2h in my case. But as for training submission models, it take days ;)
", "rawMarkdown": "Yes. I would like to gain more insights of \"tabular data engineer\" in the future as well 👍 \nIn this competition an experiment usually won't taking a day, it takes less than 2h in my case. But as for training submission models, it take days ;)", "votes": 1 }, { "id": 778705, "postDate": "2020-03-18T16:55:48.903Z", "content": "Thanks and congrats on your great result!
\n\nI would not call us tabular engineers, rather allrounders. We actually have better kaggle results on non-tabular data competitions :)
\n\nI cannot believe that you can test experiments properly in this competition within 2 hours and full model fitting then takes days. How does your CV look like and how is it different from full model fitting? It is also dependent on HW available of course.
\n\nWhat we usually do is have a CV, and then fit models on full data, which is 20% longer. Also, in this competition you had a perfectly fine public LB dataset to test how it behaves on unseen data. Why didn't you submit for a whole month? I was really curious about that.
", "rawMarkdown": "Thanks and congrats on your great result! \n\nI would not call us tabular engineers, rather allrounders. We actually have better kaggle results on non-tabular data competitions :)\n\nI cannot believe that you can test experiments properly in this competition within 2 hours and full model fitting then takes days. How does your CV look like and how is it different from full model fitting? It is also dependent on HW available of course. \n\nWhat we usually do is have a CV, and then fit models on full data, which is 20% longer. Also, in this competition you had a perfectly fine public LB dataset to test how it behaves on unseen data. Why didn't you submit for a whole month? I was really curious about that.", "votes": 1 }, { "id": 778707, "postDate": "2020-03-18T17:00:06.663Z", "content": "Worked on deepfake, and working on deepfake now....
", "rawMarkdown": "Worked on deepfake, and working on deepfake now...." }, { "id": 778709, "postDate": "2020-03-18T17:01:52.667Z", "content": "It depends on how well your CV correlates with LB and how test data looks like. In NFL we also didnt have to sub for a month.
", "rawMarkdown": "It depends on how well your CV correlates with LB and how test data looks like. In NFL we also didnt have to sub for a month." }, { "id": 778710, "postDate": "2020-03-18T17:03:31.293Z", "content": "Yes, you're right, but in my case Deepfake is too heavy and I don't have enough GPU....\nMy CV is the public one. I've make it public in the kernel. It trace LB better than the old one.
", "rawMarkdown": "Yes, you're right, but in my case Deepfake is too heavy and I don't have enough GPU....\nMy CV is the public one. I've make it public in the kernel. It trace LB better than the old one." }, { "id": 778713, "postDate": "2020-03-18T17:05:17.107Z", "content": "Which is what @dott1718 pointed out and which is what makes CV so hard and sometimes a bit frustrating. It is very difficult to test ideas properly. In best case we would always run 5-fold with multiple bags per fold to also see effects of bagging and so on. Completely impossible here.
", "rawMarkdown": "Which is what @dott1718 pointed out and which is what makes CV so hard and sometimes a bit frustrating. It is very difficult to test ideas properly. In best case we would always run 5-fold with multiple bags per fold to also see effects of bagging and so on. Completely impossible here." }, { "id": 778721, "postDate": "2020-03-18T17:11:33.720Z", "content": "Sure, it's impossible so I'm not doing 5-fold all the time. Most of my exp. is doing on only 1 fold.
", "rawMarkdown": "Sure, it's impossible so I'm not doing 5-fold all the time. Most of my exp. is doing on only 1 fold." }, { "id": 778726, "postDate": "2020-03-18T17:15:03.873Z", "content": "Which is fair but not ideal. Fitting one fold still took us 12-24hours depending on model and tests.
", "rawMarkdown": "Which is fair but not ideal. Fitting one fold still took us 12-24hours depending on model and tests." }, { "id": 778833, "postDate": "2020-03-18T19:25:06.960Z", "content": "I wonder how did you manage to run reliable experiments within 2 hours? On smaller resolution / smaller net / less epochs? For us a fit of a model, even on part of the data took up to 10-12 hours..
", "rawMarkdown": "I wonder how did you manage to run reliable experiments within 2 hours? On smaller resolution / smaller net / less epochs? For us a fit of a model, even on part of the data took up to 10-12 hours..", "votes": 2 } ] }, { "id": 775761, "postDate": "2020-03-17T00:44:12.283Z", "content": "Congratulations! Amazing solutions. I want to be an expert like you :)
", "rawMarkdown": "Congratulations! Amazing solutions. I want to be an expert like you :)", "votes": 4, "replies": [ { "id": 775771, "postDate": "2020-03-17T00:49:30.573Z", "content": "I would call 7th place an expert
", "rawMarkdown": "I would call 7th place an expert", "votes": 12 } ] }, { "id": 776738, "postDate": "2020-03-17T15:45:25.893Z", "content": "Congrats on the result and the solution!
\n\n\n\n\nAs always, we tried to understand how test data can be different, and why there is a gap to local CV.
\n
I need to learn from you on this. I already wrote it, maybe I'll start doing it ;)
", "rawMarkdown": "Congrats on the result and the solution!\n\n> As always, we tried to understand how test data can be different, and why there is a gap to local CV.\n\nI need to learn from you on this. I already wrote it, maybe I'll start doing it ;)", "votes": 1 }, { "id": 776333, "postDate": "2020-03-17T10:08:23.327Z", "content": "Congrats! Amazing result, waiting to see the details!
", "rawMarkdown": "Congrats! Amazing result, waiting to see the details!", "votes": 1 }, { "id": 775973, "postDate": "2020-03-17T03:55:20.637Z", "content": "Congrats. \nOne silly question, you guys stick with the same team name (The Zoo), what is it about? 😂
", "rawMarkdown": "Congrats. \nOne silly question, you guys stick with the same team name (The Zoo), what is it about? 😂 ", "votes": 1, "replies": [ { "id": 776264, "postDate": "2020-03-17T08:49:25.607Z", "content": "We started competing a bit more than a year ago, at first as a Friday hackathon. We needed to type something in the team name field... so we looked around and saw the the list of our virtual machines labelled with names of animals to avoid memorizing all ip addresses. So, without thinking much about it, we called ourselves The Zoo. Ending up winning that competition, we decided to stick to the name.
", "rawMarkdown": "We started competing a bit more than a year ago, at first as a Friday hackathon. We needed to type something in the team name field... so we looked around and saw the the list of our virtual machines labelled with names of animals to avoid memorizing all ip addresses. So, without thinking much about it, we called ourselves The Zoo. Ending up winning that competition, we decided to stick to the name.", "votes": 8 } ] }, { "id": 775788, "postDate": "2020-03-17T01:00:35.950Z", "content": "Congrats again The Zoo. The Tom Brady of Kaggle.
", "rawMarkdown": "Congrats again The Zoo. The Tom Brady of Kaggle.", "votes": 1, "replies": [ { "id": 776267, "postDate": "2020-03-17T08:51:45.663Z", "content": "Haha! Thanks Rob, now I feel a special connection with NFL 😄
", "rawMarkdown": "Haha! Thanks Rob, now I feel a special connection with NFL 😄 ", "votes": 1 } ] }, { "id": 778494, "postDate": "2020-03-18T13:50:57.307Z", "content": "Fantastic work and congratulations! One question:\n\"So we tried something funny, which is adding additional C=3 and C=6 predictions based on the next highest indices. Just adding 310 C=3 and 310 C=6\" - I don't understand this. Are you upsampling these rare examples? Or, do you say, \"if C=3 or C=6 is the 2nd most confident prediction, hardcode it as c=3 and c=6 instead of using the 1st most confident prediction\". Thank you
\n\nAlso, I want to emphasize that it was smart for your team to choose models predicting solely R and solely C. In fact, there was some early talk about making 3 models for each part, which I dismissed because in CHAMPS actually I saw that fitting to the extra auxiliary targets helped the model learn more. I will keep this balance in mind for the future when considering generalization, Congrats you guys are unstoppable!!
", "rawMarkdown": "Fantastic work and congratulations! One question:\n\"So we tried something funny, which is adding additional C=3 and C=6 predictions based on the next highest indices. Just adding 310 C=3 and 310 C=6\" - I don't understand this. Are you upsampling these rare examples? Or, do you say, \"if C=3 or C=6 is the 2nd most confident prediction, hardcode it as c=3 and c=6 instead of using the 1st most confident prediction\". Thank you\n\nAlso, I want to emphasize that it was smart for your team to choose models predicting solely R and solely C. In fact, there was some early talk about making 3 models for each part, which I dismissed because in CHAMPS actually I saw that fitting to the extra auxiliary targets helped the model learn more. I will keep this balance in mind for the future when considering generalization, Congrats you guys are unstoppable!!", "votes": 2, "replies": [ { "id": 778578, "postDate": "2020-03-18T15:12:27.633Z", "content": "Thanks @returnofsputnik . What we did is simply the following: rank the probabilities for C=3 (so 3rd column of consonant prediction array), and hard-set k extra cases with C=3 if they are not already predicted as C=3. We started with 155 (as this is exactly the number of samples for one grapheme) and multiplied that with a factor. Hope that's clear. So something like that:
\n\n\nidx = [z for z in np.argsort(all_preds_consonant_proba[:,3]) if all_preds_consonant[z] != 3][-155:]\nall_preds_consonant[idx] = 3\n
Wow, okay now I understand, thank you. Very clever
", "rawMarkdown": "Wow, okay now I understand, thank you. Very clever" }, { "id": 785453, "postDate": "2020-03-25T04:22:26.187Z", "content": "@philippsinger Congratulations! I am a bit confused with value 155. \n\"as this is exactly the number of samples for one grapheme\". What does this mean? Do you mean there are 155 unique graphemes with C=3 and 155 unique graphemes with C=6?
", "rawMarkdown": "@philippsinger Congratulations! I am a bit confused with value 155. \n\"as this is exactly the number of samples for one grapheme\". What does this mean? Do you mean there are 155 unique graphemes with C=3 and 155 unique graphemes with C=6? " } ] }, { "id": 776618, "postDate": "2020-03-17T14:06:32.053Z", "content": "congrats @philippsinger \nso flattered to learn from kaggle guru like you \ncongrats to all
", "rawMarkdown": "congrats @philippsinger \nso flattered to learn from kaggle guru like you \ncongrats to all ", "votes": 2 }, { "id": 775742, "postDate": "2020-03-17T00:35:30.913Z", "content": "Congratulations. May I ask what the meaning of 'average the component probabilities of all graphemes' ?
", "rawMarkdown": "Congratulations. May I ask what the meaning of 'average the component probabilities of all graphemes' ? ", "votes": 2, "replies": [ { "id": 775752, "postDate": "2020-03-17T00:39:03.087Z", "content": "When you have probabilities of each grapheme, take each possible value of e.g. root and average probabilities of all graphemes having this root. Then pick the root having maximum of \"averaged probabilities\". It improved accuracy on seen graphemes a bit and accuracy on new graphemes quite a lot.
", "rawMarkdown": "When you have probabilities of each grapheme, take each possible value of e.g. root and average probabilities of all graphemes having this root. Then pick the root having maximum of \"averaged probabilities\". It improved accuracy on seen graphemes a bit and accuracy on new graphemes quite a lot.", "votes": 3 }, { "id": 775753, "postDate": "2020-03-17T00:39:47.537Z", "content": "So if you predict on all ~1300 graphemes as target, you can decode them to the components and then we just average the probabilities of all graphemes with let's say C=2 to get the probability for C=2. This helps to generalize way better to unseen graphemes, and actually also helps seen graphemes. So win-win ... Edit: too slow
", "rawMarkdown": "So if you predict on all ~1300 graphemes as target, you can decode them to the components and then we just average the probabilities of all graphemes with let's say C=2 to get the probability for C=2. This helps to generalize way better to unseen graphemes, and actually also helps seen graphemes. So win-win ... Edit: too slow", "votes": 1 }, { "id": 776181, "postDate": "2020-03-17T07:19:49.723Z", "content": "Sorry, but I still didn't get. So we take the probabilities of all graphemes predicted as C=2 and average them and then use this as the prediction instead of the original probability?
", "rawMarkdown": "Sorry, but I still didn't get. So we take the probabilities of all graphemes predicted as C=2 and average them and then use this as the prediction instead of the original probability? " }, { "id": 776217, "postDate": "2020-03-17T07:59:06.663Z", "content": "so this is similar to adding prior distribution of each root?
", "rawMarkdown": " so this is similar to adding prior distribution of each root? " }, { "id": 776408, "postDate": "2020-03-17T11:19:15.407Z", "content": "It's rather an empirical post-processing step and the resulting numbers are not probabilities anymore (they don't sum up to 1). Let me elaborate a bit.\nLet's take C (consonant) component, which has 7 possible values. A grapheme model has 1295 outputs, which are probabilities of the corresponding graphemes. For each value of C we take the predicted probabilities of all graphemes with that particular C and average them. For instance, there are only 4 graphemes with C=3, we take the average of 4 probabilities of those for C=3. For C=0 there are way more graphemes, we average those probs. As the result, we get 7 numbers, one per each possible value of C. To decide on the prediction we pick C value, which corresponds to the highest of the post-processed numbers.\nThese number are not probabilities anymore, but reflect the likeliness of the corresponding target.
", "rawMarkdown": "It's rather an empirical post-processing step and the resulting numbers are not probabilities anymore (they don't sum up to 1). Let me elaborate a bit.\nLet's take C (consonant) component, which has 7 possible values. A grapheme model has 1295 outputs, which are probabilities of the corresponding graphemes. For each value of C we take the predicted probabilities of all graphemes with that particular C and average them. For instance, there are only 4 graphemes with C=3, we take the average of 4 probabilities of those for C=3. For C=0 there are way more graphemes, we average those probs. As the result, we get 7 numbers, one per each possible value of C. To decide on the prediction we pick C value, which corresponds to the highest of the post-processed numbers.\nThese number are not probabilities anymore, but reflect the likeliness of the corresponding target.", "votes": 4 }, { "id": 784043, "postDate": "2020-03-23T22:47:09.217Z", "content": "Congrat! May I ask what is the theory/methodolgy/justification behind this approach. I would like to read into it.
\n\nIt seems that you somehow associate the prediction of r, c and v to the graphemes distribution in training data and wouldn't this mean you risk overfitting to seen data even more? So I dont quite understand when you say it helps with unseen data.
\n\nMany thanks!
", "rawMarkdown": "Congrat! May I ask what is the theory/methodolgy/justification behind this approach. I would like to read into it. \n\nIt seems that you somehow associate the prediction of r, c and v to the graphemes distribution in training data and wouldn't this mean you risk overfitting to seen data even more? So I dont quite understand when you say it helps with unseen data.\n\nMany thanks!" }, { "id": 785002, "postDate": "2020-03-24T17:29:38.997Z", "content": "No theory behind it, but it was natural to try different ways to go from grapheme level to component level and this is what worked best.
", "rawMarkdown": "No theory behind it, but it was natural to try different ways to go from grapheme level to component level and this is what worked best.", "votes": 1 } ] }, { "id": 775715, "postDate": "2020-03-17T00:22:01.470Z", "content": "Really want to learn from how you guys can do systematic analysis of the nature of data and applying task-specific approaches. I would say this is a more than reasonable and systematic solution. Congratulations!
", "rawMarkdown": "Really want to learn from how you guys can do systematic analysis of the nature of data and applying task-specific approaches. I would say this is a more than reasonable and systematic solution. Congratulations!", "votes": 1 }, { "id": 786867, "postDate": "2020-03-26T09:30:41.783Z", "content": "nice work
", "rawMarkdown": "nice work" }, { "id": 785575, "postDate": "2020-03-25T07:08:39.753Z", "content": "Congratulations @philippsinger and @dott1718 8, I had a doubt.
\n\n\n\n\nSpecifically for C it was very hard to generalize and what helped a bit was to randomly add generated graphemes based on the code we found in this kernel (kudos to the author!) https://www.kaggle.com/kaushal2896/bengali-graphemes-starter-eda-multi-output-cnn
\n
I still didn't get how you generated grapheme using that kernel. My guess is that you used this function:
\n\ndef image_from_char(char):\n image = Image.new('RGB', (WIDTH, HEIGHT))\n draw = ImageDraw.Draw(image)\n myfont = ImageFont.truetype('/kaggle/input/kalpurush-fonts/kalpurush-2.ttf', 120)\n w, h = draw.textsize(char, font=myfont)\n draw.text(((WIDTH - w) / 2,(HEIGHT - h) / 3), char, font=myfont)\nreturn image
But then, how did you combine R, C, and V to create grapheme?
", "rawMarkdown": "Congratulations @philippsinger and @dott1718 8, I had a doubt. \n\n> Specifically for C it was very hard to generalize and what helped a bit was to randomly add generated graphemes based on the code we found in this kernel (kudos to the author!) https://www.kaggle.com/kaushal2896/bengali-graphemes-starter-eda-multi-output-cnn\n\nI still didn't get how you generated grapheme using that kernel. My guess is that you used this function:\n\n`def image_from_char(char):\n image = Image.new('RGB', (WIDTH, HEIGHT))\n draw = ImageDraw.Draw(image)\n myfont = ImageFont.truetype('/kaggle/input/kalpurush-fonts/kalpurush-2.ttf', 120)\n w, h = draw.textsize(char, font=myfont)\n draw.text(((WIDTH - w) / 2,(HEIGHT - h) / 3), char, font=myfont)\nreturn image`\n\nBut then, how did you combine R, C, and V to create grapheme? " }, { "id": 778565, "postDate": "2020-03-18T15:05:43.833Z", "content": "Congrats ! The post processing idea is really cool. Also, didn't you guys face timeout issues, since we had a 2 hour of limitation on GPU time and you had 7 different models to run?
", "rawMarkdown": "Congrats ! The post processing idea is really cool. Also, didn't you guys face timeout issues, since we had a 2 hour of limitation on GPU time and you had 7 different models to run?", "replies": [ { "id": 778573, "postDate": "2020-03-18T15:10:03.607Z", "content": "No, never had a timeout. One model took 15min approx.
", "rawMarkdown": "No, never had a timeout. One model took 15min approx." } ] }, { "id": 778500, "postDate": "2020-03-18T14:02:48.633Z", "content": "THE ZOO! 💪
", "rawMarkdown": "THE ZOO! 💪" }, { "id": 777798, "postDate": "2020-03-18T00:15:29.660Z", "content": "Congrats! I'm always interested in looking Zoo team's solution. @philippsinger @dott1718 \nYour approach to deeply understanding train/test data to consider the solution is impressive.
\n\nHow did you determine blending weight? by local hold-out testing?
", "rawMarkdown": "Congrats! I'm always interested in looking Zoo team's solution. @philippsinger @dott1718 \nYour approach to deeply understanding train/test data to consider the solution is impressive.\n\nHow did you determine blending weight? by local hold-out testing?", "replies": [ { "id": 778228, "postDate": "2020-03-18T08:50:18.517Z", "content": "Yep, we had a local CV where holdout contained unseen graphemes which is where we determined the weights. Interestingly, scores on LB really matched these weights, we slightly tuned them on LB also though.
", "rawMarkdown": "Yep, we had a local CV where holdout contained unseen graphemes which is where we determined the weights. Interestingly, scores on LB really matched these weights, we slightly tuned them on LB also though.", "votes": 1 }, { "id": 778247, "postDate": "2020-03-18T09:19:34.230Z", "content": "I see, thanks!
", "rawMarkdown": "I see, thanks!" } ] }, { "id": 776243, "postDate": "2020-03-17T08:28:32.677Z", "content": "Congrats. Cant wait to see your details.
", "rawMarkdown": "Congrats. Cant wait to see your details." }, { "id": 775969, "postDate": "2020-03-17T03:51:01.413Z", "content": "[question placeholder]
\n\nCongratulation!\nCant wait to see your full post!
", "rawMarkdown": "[question placeholder]\n\nCongratulation!\nCant wait to see your full post!" }, { "id": 775868, "postDate": "2020-03-17T02:05:55.030Z", "content": "Congrats! So amazing! I think that's the magic they talked about~
", "rawMarkdown": "Congrats! So amazing! I think that's the magic they talked about~" }, { "id": 775773, "postDate": "2020-03-17T00:51:53.600Z", "content": "The dream Zoo 😄
", "rawMarkdown": "The dream Zoo 😄", "replies": [ { "id": 776107, "postDate": "2020-03-17T05:57:51.220Z", "content": "youngtard sabi The Zoo omo Nigeria
", "rawMarkdown": "youngtard sabi The Zoo omo Nigeria\n" } ] }, { "id": 775757, "postDate": "2020-03-17T00:42:24.217Z", "content": "The Zoo does it again! Congrats and amazing solution, can't wait to read the full writeup!
", "rawMarkdown": "The Zoo does it again! Congrats and amazing solution, can't wait to read the full writeup!" }, { "id": 775755, "postDate": "2020-03-17T00:40:13.513Z", "content": "Congratulations and nice work! I've also averaged the probabilities of all graphemes to deal with unseen but it seems not work for me T.T, look forward to the details!
", "rawMarkdown": "Congratulations and nice work! I've also averaged the probabilities of all graphemes to deal with unseen but it seems not work for me T.T, look forward to the details!" }, { "id": 775741, "postDate": "2020-03-17T00:35:25.433Z", "content": "Congrats, thanks for sharing and looking forward to the full writeup!
\n\nCan confirm that training on graphemes and using 3 component heads jointly really overfit to seen graphemes... Lesson learned.
", "rawMarkdown": "Congrats, thanks for sharing and looking forward to the full writeup! \n\nCan confirm that training on graphemes and using 3 component heads jointly really overfit to seen graphemes... Lesson learned. ", "replies": [ { "id": 775756, "postDate": "2020-03-17T00:41:32.930Z", "content": "\"Can confirm that training on graphemes and using 3 component heads jointly really overfit to seen graphemes\"
\n\nmy submission and checking those at the open notebook shows decoding using graphemes saw a drop of about 3 to 4% compared to prediction of the three components .
\n\nthis gives an estimate of number of the unseen graphemes in private lb
", "rawMarkdown": "\"Can confirm that training on graphemes and using 3 component heads jointly really overfit to seen graphemes\"\n\nmy submission and checking those at the open notebook shows decoding using graphemes saw a drop of about 3 to 4% compared to prediction of the three components .\n\nthis gives an estimate of number of the unseen graphemes in private lb" } ] }, { "id": 1297778, "postDate": "2021-05-08T09:56:56.860Z", "rawMarkdown": "", "isDeleted": true }, { "id": 775885, "postDate": "2020-03-17T02:18:29.440Z", "rawMarkdown": "", "isDeleted": true } ], "comments": [ { "id": 786859, "author_name": "Aman Arora", "author_url": "", "post_date": "2020-03-26T09:24:18.093000", "content": "This is the most interesting solution that I've read for this competition so far. I have read at least 50 solutions but the reason why I personally like this solution write up so much is because it conveys a story and the thinking. \nThat to me, is way more important than just seeing a solution which says \"try cutmix\" or \"use GANs to get synthetic data\".
\n\nI want to thank the authors for the win and also for this amazing write up, personally the learnings have come from reading this solution and I'll try to reimplement it, to learn even more. (Devil is in the details I think)
\n\nOnce again, thank you :)
", "votes": 7, "replies": [ { "id": 787150, "author_name": "Psi", "author_url": "", "post_date": "2020-03-26T14:59:04.937000", "content": "Thanks, happy if it helps :)
", "votes": 2, "replies": [] } ] }, { "id": 776672, "author_name": "Psi", "author_url": "", "post_date": "2020-03-17T14:46:02.037000", "content": "Updated the solution post!
", "votes": 5, "replies": [] }, { "id": 775731, "author_name": "hengck23", "author_url": "", "post_date": "2020-03-17T00:33:00.847000", "content": "congrats and nice work!
\n\ndoes it prove that GAN beats autoaugment (or other augment) here?
\n\nit is nice to see GAN being used and shown to improve results. This also means that the quality of kaggle solution has been brought to a new higher level.
", "votes": 6, "replies": [ { "id": 775749, "author_name": "Psi", "author_url": "", "post_date": "2020-03-17T00:38:31.203000", "content": "I dont know, it is honestly just a guess what top solution did. Hope we will learn.
", "votes": 0, "replies": [] } ] }, { "id": 777592, "author_name": "Chris Deotte", "author_url": "", "post_date": "2020-03-17T19:56:29.500000", "content": "Congrats on another top gold cash finish. The Zoo is incredible!
\n\nGreat model. Your procedure of predicting one of 1295 graphemes and then choosing R, C, V component by averaging probabilities is great. That removes the biases of R, C, V class imbalances and does it in a more natural way than multiplying R, C, V probabilities by the inverse of their class frequency. Basically you assume a uniform distribution of graphemes and set the distribution of R, C, V based on that.
\n\nThanks for sharing Fmix, I didn't know about that, I'll check that out. The image you post does look more natural than CutMix. I used CAM CutMix which also did better than CutMix and looks more natural too.
\n\nWhat does \"30 points\" on LB mean?
", "votes": 3, "replies": [ { "id": 777621, "author_name": "Psi", "author_url": "", "post_date": "2020-03-17T20:27:32.920000", "content": "It is a cherry-picked image, but in general they look way more natural.
\n\n30 points means for example 9850 --> 9880
", "votes": 1, "replies": [] } ] }, { "id": 775869, "author_name": "Gary", "author_url": "", "post_date": "2020-03-17T02:07:32.667000", "content": "congratulations, I couldn't agree more that models fitted on graphemes instead of R,C,V separately, I learned a lesson this time.
What you guys are doing is so different from us computer vision engineers. It seems that people who good at tabular data does think in a different way than the people who are mainly doing CV. I learned a lot from your post. Thanks!
", "votes": 4, "replies": [ { "id": 778670, "author_name": "dott", "author_url": "", "post_date": "2020-03-18T16:24:08.513000", "content": "This is a great point as we wanted to learn more about how different computer vision is to other types of tasks. I would say that nlp is quite similar to tabular data in many general aspects, but computer vision seems to require a different approach. It is still unclear to me how can you efficiently test ideas if a single fit of a model can take days. Not even talking about getting full 5-fold CV... I think we've learnt a lot during this month, but there is still a lot more to learn and, more importantly, more to adjust in line of thinking, approaching the task and building the modelling pipelines. But I am kinda happy it is a long learning curve, looking forward to gain more insights in \"computer vision engineer\" way of doing it!
", "votes": 7, "replies": [] }, { "id": 778683, "author_name": "Qishen Ha", "author_url": "", "post_date": "2020-03-18T16:34:30.630000", "content": "Yes. I would like to gain more insights of \"tabular data engineer\" in the future as well 👍 \nIn this competition an experiment usually won't taking a day, it takes less than 2h in my case. But as for training submission models, it take days ;)
", "votes": 1, "replies": [] }, { "id": 778705, "author_name": "Psi", "author_url": "", "post_date": "2020-03-18T16:55:48.903000", "content": "Thanks and congrats on your great result!
\n\nI would not call us tabular engineers, rather allrounders. We actually have better kaggle results on non-tabular data competitions :)
\n\nI cannot believe that you can test experiments properly in this competition within 2 hours and full model fitting then takes days. How does your CV look like and how is it different from full model fitting? It is also dependent on HW available of course.
\n\nWhat we usually do is have a CV, and then fit models on full data, which is 20% longer. Also, in this competition you had a perfectly fine public LB dataset to test how it behaves on unseen data. Why didn't you submit for a whole month? I was really curious about that.
", "votes": 1, "replies": [] }, { "id": 778707, "author_name": "Qishen Ha", "author_url": "", "post_date": "2020-03-18T17:00:06.663000", "content": "Worked on deepfake, and working on deepfake now....
", "votes": 0, "replies": [] }, { "id": 778709, "author_name": "Psi", "author_url": "", "post_date": "2020-03-18T17:01:52.667000", "content": "It depends on how well your CV correlates with LB and how test data looks like. In NFL we also didnt have to sub for a month.
", "votes": 0, "replies": [] }, { "id": 778710, "author_name": "Qishen Ha", "author_url": "", "post_date": "2020-03-18T17:03:31.293000", "content": "Yes, you're right, but in my case Deepfake is too heavy and I don't have enough GPU....\nMy CV is the public one. I've make it public in the kernel. It trace LB better than the old one.
", "votes": 0, "replies": [] }, { "id": 778713, "author_name": "Psi", "author_url": "", "post_date": "2020-03-18T17:05:17.107000", "content": "Which is what @dott1718 pointed out and which is what makes CV so hard and sometimes a bit frustrating. It is very difficult to test ideas properly. In best case we would always run 5-fold with multiple bags per fold to also see effects of bagging and so on. Completely impossible here.
", "votes": 0, "replies": [] }, { "id": 778721, "author_name": "Qishen Ha", "author_url": "", "post_date": "2020-03-18T17:11:33.720000", "content": "Sure, it's impossible so I'm not doing 5-fold all the time. Most of my exp. is doing on only 1 fold.
", "votes": 0, "replies": [] }, { "id": 778726, "author_name": "Psi", "author_url": "", "post_date": "2020-03-18T17:15:03.873000", "content": "Which is fair but not ideal. Fitting one fold still took us 12-24hours depending on model and tests.
", "votes": 0, "replies": [] }, { "id": 778833, "author_name": "dott", "author_url": "", "post_date": "2020-03-18T19:25:06.960000", "content": "I wonder how did you manage to run reliable experiments within 2 hours? On smaller resolution / smaller net / less epochs? For us a fit of a model, even on part of the data took up to 10-12 hours..
", "votes": 2, "replies": [] } ] }, { "id": 775761, "author_name": "Youhan Lee", "author_url": "", "post_date": "2020-03-17T00:44:12.283000", "content": "Congratulations! Amazing solutions. I want to be an expert like you :)
", "votes": 4, "replies": [ { "id": 775771, "author_name": "Psi", "author_url": "", "post_date": "2020-03-17T00:49:30.573000", "content": "I would call 7th place an expert
", "votes": 12, "replies": [] } ] }, { "id": 776738, "author_name": "CPMP", "author_url": "", "post_date": "2020-03-17T15:45:25.893000", "content": "Congrats on the result and the solution!
\n\n\n\n\nAs always, we tried to understand how test data can be different, and why there is a gap to local CV.
\n
I need to learn from you on this. I already wrote it, maybe I'll start doing it ;)
", "votes": 1, "replies": [] }, { "id": 776333, "author_name": "Max Jeblick", "author_url": "", "post_date": "2020-03-17T10:08:23.327000", "content": "Congrats! Amazing result, waiting to see the details!
", "votes": 1, "replies": [] }, { "id": 775973, "author_name": "Innat", "author_url": "", "post_date": "2020-03-17T03:55:20.637000", "content": "Congrats. \nOne silly question, you guys stick with the same team name (The Zoo), what is it about? 😂
", "votes": 1, "replies": [ { "id": 776264, "author_name": "dott", "author_url": "", "post_date": "2020-03-17T08:49:25.607000", "content": "We started competing a bit more than a year ago, at first as a Friday hackathon. We needed to type something in the team name field... so we looked around and saw the the list of our virtual machines labelled with names of animals to avoid memorizing all ip addresses. So, without thinking much about it, we called ourselves The Zoo. Ending up winning that competition, we decided to stick to the name.
", "votes": 8, "replies": [] } ] }, { "id": 775788, "author_name": "Rob Mulla", "author_url": "", "post_date": "2020-03-17T01:00:35.950000", "content": "Congrats again The Zoo. The Tom Brady of Kaggle.
", "votes": 1, "replies": [ { "id": 776267, "author_name": "dott", "author_url": "", "post_date": "2020-03-17T08:51:45.663000", "content": "Haha! Thanks Rob, now I feel a special connection with NFL 😄
", "votes": 1, "replies": [] } ] }, { "id": 778494, "author_name": "CoreyJamesLevinson", "author_url": "", "post_date": "2020-03-18T13:50:57.307000", "content": "Fantastic work and congratulations! One question:\n\"So we tried something funny, which is adding additional C=3 and C=6 predictions based on the next highest indices. Just adding 310 C=3 and 310 C=6\" - I don't understand this. Are you upsampling these rare examples? Or, do you say, \"if C=3 or C=6 is the 2nd most confident prediction, hardcode it as c=3 and c=6 instead of using the 1st most confident prediction\". Thank you
\n\nAlso, I want to emphasize that it was smart for your team to choose models predicting solely R and solely C. In fact, there was some early talk about making 3 models for each part, which I dismissed because in CHAMPS actually I saw that fitting to the extra auxiliary targets helped the model learn more. I will keep this balance in mind for the future when considering generalization, Congrats you guys are unstoppable!!
", "votes": 2, "replies": [ { "id": 778578, "author_name": "Psi", "author_url": "", "post_date": "2020-03-18T15:12:27.633000", "content": "Thanks @returnofsputnik . What we did is simply the following: rank the probabilities for C=3 (so 3rd column of consonant prediction array), and hard-set k extra cases with C=3 if they are not already predicted as C=3. We started with 155 (as this is exactly the number of samples for one grapheme) and multiplied that with a factor. Hope that's clear. So something like that:
\n\n\nidx = [z for z in np.argsort(all_preds_consonant_proba[:,3]) if all_preds_consonant[z] != 3][-155:]\nall_preds_consonant[idx] = 3\n
Wow, okay now I understand, thank you. Very clever
", "votes": 0, "replies": [] }, { "id": 785453, "author_name": "Viraj Bagal", "author_url": "", "post_date": "2020-03-25T04:22:26.187000", "content": "@philippsinger Congratulations! I am a bit confused with value 155. \n\"as this is exactly the number of samples for one grapheme\". What does this mean? Do you mean there are 155 unique graphemes with C=3 and 155 unique graphemes with C=6?
", "votes": 0, "replies": [] } ] }, { "id": 776618, "author_name": "Yassine Hamdaoui", "author_url": "", "post_date": "2020-03-17T14:06:32.053000", "content": "congrats @philippsinger \nso flattered to learn from kaggle guru like you \ncongrats to all
", "votes": 2, "replies": [] }, { "id": 775742, "author_name": "Morphy", "author_url": "", "post_date": "2020-03-17T00:35:30.913000", "content": "Congratulations. May I ask what the meaning of 'average the component probabilities of all graphemes' ?
", "votes": 2, "replies": [ { "id": 775752, "author_name": "dott", "author_url": "", "post_date": "2020-03-17T00:39:03.087000", "content": "When you have probabilities of each grapheme, take each possible value of e.g. root and average probabilities of all graphemes having this root. Then pick the root having maximum of \"averaged probabilities\". It improved accuracy on seen graphemes a bit and accuracy on new graphemes quite a lot.
", "votes": 3, "replies": [] }, { "id": 775753, "author_name": "Psi", "author_url": "", "post_date": "2020-03-17T00:39:47.537000", "content": "So if you predict on all ~1300 graphemes as target, you can decode them to the components and then we just average the probabilities of all graphemes with let's say C=2 to get the probability for C=2. This helps to generalize way better to unseen graphemes, and actually also helps seen graphemes. So win-win ... Edit: too slow
", "votes": 1, "replies": [] }, { "id": 776181, "author_name": "Syed Saad", "author_url": "", "post_date": "2020-03-17T07:19:49.723000", "content": "Sorry, but I still didn't get. So we take the probabilities of all graphemes predicted as C=2 and average them and then use this as the prediction instead of the original probability?
", "votes": 0, "replies": [] }, { "id": 776217, "author_name": "Morphy", "author_url": "", "post_date": "2020-03-17T07:59:06.663000", "content": "so this is similar to adding prior distribution of each root?
", "votes": 0, "replies": [] }, { "id": 776408, "author_name": "dott", "author_url": "", "post_date": "2020-03-17T11:19:15.407000", "content": "It's rather an empirical post-processing step and the resulting numbers are not probabilities anymore (they don't sum up to 1). Let me elaborate a bit.\nLet's take C (consonant) component, which has 7 possible values. A grapheme model has 1295 outputs, which are probabilities of the corresponding graphemes. For each value of C we take the predicted probabilities of all graphemes with that particular C and average them. For instance, there are only 4 graphemes with C=3, we take the average of 4 probabilities of those for C=3. For C=0 there are way more graphemes, we average those probs. As the result, we get 7 numbers, one per each possible value of C. To decide on the prediction we pick C value, which corresponds to the highest of the post-processed numbers.\nThese number are not probabilities anymore, but reflect the likeliness of the corresponding target.
", "votes": 4, "replies": [] }, { "id": 784043, "author_name": "YL", "author_url": "", "post_date": "2020-03-23T22:47:09.217000", "content": "Congrat! May I ask what is the theory/methodolgy/justification behind this approach. I would like to read into it.
\n\nIt seems that you somehow associate the prediction of r, c and v to the graphemes distribution in training data and wouldn't this mean you risk overfitting to seen data even more? So I dont quite understand when you say it helps with unseen data.
\n\nMany thanks!
", "votes": 0, "replies": [] }, { "id": 785002, "author_name": "Psi", "author_url": "", "post_date": "2020-03-24T17:29:38.997000", "content": "No theory behind it, but it was natural to try different ways to go from grapheme level to component level and this is what worked best.
", "votes": 1, "replies": [] } ] }, { "id": 775715, "author_name": "Nicholas Lyu", "author_url": "", "post_date": "2020-03-17T00:22:01.470000", "content": "Really want to learn from how you guys can do systematic analysis of the nature of data and applying task-specific approaches. I would say this is a more than reasonable and systematic solution. Congratulations!
", "votes": 1, "replies": [] }, { "id": 786867, "author_name": "Inzamamul Alam", "author_url": "", "post_date": "2020-03-26T09:30:41.783000", "content": "nice work
", "votes": 0, "replies": [] }, { "id": 785575, "author_name": "Viraj Bagal", "author_url": "", "post_date": "2020-03-25T07:08:39.753000", "content": "Congratulations @philippsinger and @dott1718 8, I had a doubt.
\n\n\n\n\nSpecifically for C it was very hard to generalize and what helped a bit was to randomly add generated graphemes based on the code we found in this kernel (kudos to the author!) https://www.kaggle.com/kaushal2896/bengali-graphemes-starter-eda-multi-output-cnn
\n
I still didn't get how you generated grapheme using that kernel. My guess is that you used this function:
\n\ndef image_from_char(char):\n image = Image.new('RGB', (WIDTH, HEIGHT))\n draw = ImageDraw.Draw(image)\n myfont = ImageFont.truetype('/kaggle/input/kalpurush-fonts/kalpurush-2.ttf', 120)\n w, h = draw.textsize(char, font=myfont)\n draw.text(((WIDTH - w) / 2,(HEIGHT - h) / 3), char, font=myfont)\nreturn image
But then, how did you combine R, C, and V to create grapheme?
", "votes": 0, "replies": [] }, { "id": 778565, "author_name": "Syed Saad", "author_url": "", "post_date": "2020-03-18T15:05:43.833000", "content": "Congrats ! The post processing idea is really cool. Also, didn't you guys face timeout issues, since we had a 2 hour of limitation on GPU time and you had 7 different models to run?
", "votes": 0, "replies": [ { "id": 778573, "author_name": "Psi", "author_url": "", "post_date": "2020-03-18T15:10:03.607000", "content": "No, never had a timeout. One model took 15min approx.
", "votes": 0, "replies": [] } ] }, { "id": 778500, "author_name": "nicapotato", "author_url": "", "post_date": "2020-03-18T14:02:48.633000", "content": "THE ZOO! 💪
", "votes": 0, "replies": [] }, { "id": 777798, "author_name": "corochann", "author_url": "", "post_date": "2020-03-18T00:15:29.660000", "content": "Congrats! I'm always interested in looking Zoo team's solution. @philippsinger @dott1718 \nYour approach to deeply understanding train/test data to consider the solution is impressive.
\n\nHow did you determine blending weight? by local hold-out testing?
", "votes": 0, "replies": [ { "id": 778228, "author_name": "Psi", "author_url": "", "post_date": "2020-03-18T08:50:18.517000", "content": "Yep, we had a local CV where holdout contained unseen graphemes which is where we determined the weights. Interestingly, scores on LB really matched these weights, we slightly tuned them on LB also though.
", "votes": 1, "replies": [] }, { "id": 778247, "author_name": "corochann", "author_url": "", "post_date": "2020-03-18T09:19:34.230000", "content": "I see, thanks!
", "votes": 0, "replies": [] } ] }, { "id": 776243, "author_name": "Bryce1010", "author_url": "", "post_date": "2020-03-17T08:28:32.677000", "content": "Congrats. Cant wait to see your details.
", "votes": 0, "replies": [] }, { "id": 775969, "author_name": "Qishen Ha", "author_url": "", "post_date": "2020-03-17T03:51:01.413000", "content": "[question placeholder]
\n\nCongratulation!\nCant wait to see your full post!
", "votes": 0, "replies": [] }, { "id": 775868, "author_name": "Helen", "author_url": "", "post_date": "2020-03-17T02:05:55.030000", "content": "Congrats! So amazing! I think that's the magic they talked about~
", "votes": 0, "replies": [] }, { "id": 775773, "author_name": "Sotonwa Femi", "author_url": "", "post_date": "2020-03-17T00:51:53.600000", "content": "The dream Zoo 😄
", "votes": 0, "replies": [ { "id": 776107, "author_name": "Raheem Nasirudeen", "author_url": "", "post_date": "2020-03-17T05:57:51.220000", "content": "youngtard sabi The Zoo omo Nigeria
", "votes": 0, "replies": [] } ] }, { "id": 775757, "author_name": "GreatGameDota", "author_url": "", "post_date": "2020-03-17T00:42:24.217000", "content": "The Zoo does it again! Congrats and amazing solution, can't wait to read the full writeup!
", "votes": 0, "replies": [] }, { "id": 775755, "author_name": "ccchang", "author_url": "", "post_date": "2020-03-17T00:40:13.513000", "content": "Congratulations and nice work! I've also averaged the probabilities of all graphemes to deal with unseen but it seems not work for me T.T, look forward to the details!
", "votes": 0, "replies": [] }, { "id": 775741, "author_name": "Ian Pan", "author_url": "", "post_date": "2020-03-17T00:35:25.433000", "content": "Congrats, thanks for sharing and looking forward to the full writeup!
\n\nCan confirm that training on graphemes and using 3 component heads jointly really overfit to seen graphemes... Lesson learned.
", "votes": 0, "replies": [ { "id": 775756, "author_name": "hengck23", "author_url": "", "post_date": "2020-03-17T00:41:32.930000", "content": "\"Can confirm that training on graphemes and using 3 component heads jointly really overfit to seen graphemes\"
\n\nmy submission and checking those at the open notebook shows decoding using graphemes saw a drop of about 3 to 4% compared to prediction of the three components .
\n\nthis gives an estimate of number of the unseen graphemes in private lb
", "votes": 0, "replies": [] } ] }, { "id": 1297778, "author_name": "", "author_url": "", "post_date": "2021-05-08T09:56:56.860000", "content": "", "votes": 0, "replies": [] }, { "id": 775885, "author_name": "", "author_url": "", "post_date": "2020-03-17T02:18:29.440000", "content": "", "votes": 0, "replies": [] } ], "raw_markdown_by_id": { "775706": "Thanks a lot to the host and Kaggle for this very interesting competition. We learned a lot and specifically the issue of predicting unseen graphemes in test data was very intriguing and has led to some very elegant and nice solutions as imminent from all the other solution posts. As always, this has been an incredible Zoo team effort and always amazing to collaborate with @dott1718.\n\nWe will try to tell the story of progress a bit, without only explaining the end solution as we believe that the whole process of a competition is important to understand how decisions have been made.\n\n### Early efforts\nWe started the competition by fitting 3-head models for R,C,V and quite quickly got reasonable results landing us somewhere in range of top 40-50 on LB. As always, we tried to understand how test data can be different, and why there is a gap to local CV. It became quite quickly clear to us that it is mostly due to unseen graphemes in test. We tried to assess how such a gap can exist, and checked how R, C and V scored individually on LB (you can figure this out quite easily by predicting all 0s for the rest, which is baseline sub). We saw that most drop comes from R and C, which is impacted by the huge effect of rare case misclassifications. So we tried something funny, which is adding additional C=3 and C=6 predictions based on the next highest indices. Just adding 310 C=3 and 310 C=6 (which reflects one extra grapheme for each) boosted us 30-40 points on LB. So we figured that this will be key in the end, and we need to generate a solution that generalizes well to unseen ones. We did also not want to rely on hardcoding too much, so tried to find a better way. These early subs with no blending at all, but this simple hardcoding, would btw still be rank 10-20 now.\n\n### Grapheme models and fitting\nSeeing reported CV scores on forums, which were all quite higher than ours, made us think that top teams are doing something different than us, which apparently was different targets. So our, first trick was to switch from predicting R,C,V to predicting individual graphemes. This also had benefits to us for not needing to care about proper loss weights of the 3 heads, different learning weights for the heads, how to deal with soft labels properly, and we could focus fully on NN fitting and augmentations. After we switched, mixing augmentations shined immediately - we replaced cutout with cutmix and then with fmix, which made it to the final models we had. Fmix (https://arxiv.org/abs/2002.12047) worked clearly better for us than cutmix, and also the resulting images looked way more natural to us due to the way the cut areas are picked. This is an example of a mixed image:\n\n\n\nIn the end, we mixed either 2 images or 3 images with 50% probability and used beta=4 to mostly do equal mixing. \n\nHaving this grapheme model, the tricky part was to apply the model to test. At first, we tried applying the model as it is, so predicting only the known graphemes by just converting the predicted grapheme to its R,C,V components. LB score was better than for the model predicting R,C,V separately, which tells us there are not that many new unseen graphemes in public LB. To make the model work better on unseen graphemes, we applied the second trick - a post-processing routine. Surprisingly, it also improved the metric on the known graphemes as well.\n\nThe model outputs 1295 probabilities of each distinct train grapheme. For each component, e.g. C, we calculate the scores of each C=0,..,6 by averaging probabilities of the graphemes having this component. So, for C=3 it is an average of only 4 probabilities as there are only 4 graphemes with consonant diacritic of 3 in train data. For C=0 it is an average of hundreds of probabilities as it is the most common C value. The post-processing ends with picking C value with the highest “score”. The logic behind it was to treat each C value equally regardless of its frequency similar to the target metric, not to limit the model to the set of train graphemes, and pick more likely component values for the graphemes with non-confident predictions. This routine immediately gave us another 50 extra points on LB.\n\n### Improving unseen graphemes\nThe third trick was about improving the predictions of unseen graphemes without hurting predictions of known graphemes too much. As most of you probably know and as elaborated earlier, the gap between cross-validation and public LB was coming from the drop of accuracy in the C component, caused mainly by C=3 and to lesser extent by C=6. It is easy to explain, as these are the rarest classes in train, and most probably public LB has at least one new grapheme with C=3 and C=6. The second largest drop was coming from the R component, while V recall was quite close between cross-validation and public LB.\n\nThe main problem with both 3-head models and specifically grapheme models is that they overfit to the seen graphemes as they are heavily memorizing them. So to close the gap a bit, we needed models which predict R and C better on unseen graphemes, which led us to fitting individual models for these 2 components. Specifically for C it was very hard to generalize and what helped a bit was to randomly add generated graphemes based on the code we found in this kernel (kudos to the author!) https://www.kaggle.com/kaushal2896/bengali-graphemes-starter-eda-multi-output-cnn. But, as we learnt after the end of the competition, there was way more room to improve the models this way than we actually did.\n\n### Blending \nTrick number four was about how to blend the models together. To test the blending approaches, we recreated the hold-out sample by removing a few graphemes completely from the training part, also a couple of graphemes with C=3 and 6. We ended up doing different blending per component. But first, the models we had by the end of the competition are:\n- 3 grapheme models, fitted on the whole train. The modes use adam and sgd scheduling, fitted for 80 - 130 epochs and all use fmix mixing 2-3 images.\n- 1 model with 3-heads for all components. Cutout instead of fmix, sgd and 40 epochs, similar to all the following models\n- 1 model for R\n- 2 models for C\n\nFor R the blend is: post-processed average of grapheme models + 0.4 * average of 3-heads model and R model\n\nFor V the blend is: post-processed average of grapheme models + 0.2 * 3-heads model scaled to have equal means\n\nFor C the blend is: post-processed average of grapheme models + 15 * average of C models * C class weights\n\nC class weights were introduced to fix the imbalanced frequencies of C, especially C=3 and 6. They were set to inverse frequencies of the class in train and normalized.\n\n6 out of 7 models are SE Resnext50 and one is SE Resnext101. Image size was either original or 224x224. Adam scheduling with decay worked well, but SGD with scaled down every X epochs was even better. Fmix was done on the entire sample, meaning that for each image there were 2 or 3 (random with prob=0.5) random images picked from the whole training sample and mixed. \n\nHappy to try to answer any questions!\n\n\n", "786859": "This is the most interesting solution that I've read for this competition so far. I have read at least 50 solutions but the reason why I personally like this solution write up so much is because it conveys a story and the thinking. \nThat to me, is way more important than just seeing a solution which says \"try cutmix\" or \"use GANs to get synthetic data\". \n\nI want to thank the authors for the win and also for this amazing write up, personally the learnings have come from reading this solution and I'll try to reimplement it, to learn even more. (Devil is in the details I think) \n\nOnce again, thank you :)", "776672": "Updated the solution post!", "775731": "congrats and nice work!\n\ndoes it prove that GAN beats autoaugment (or other augment) here?\n\nit is nice to see GAN being used and shown to improve results. This also means that the quality of kaggle solution has been brought to a new higher level.\n", "777592": "Congrats on another top gold cash finish. The Zoo is incredible!\n\nGreat model. Your procedure of predicting one of 1295 graphemes and then choosing R, C, V component by averaging probabilities is great. That removes the biases of R, C, V class imbalances and does it in a more natural way than multiplying R, C, V probabilities by the inverse of their class frequency. Basically you assume a uniform distribution of graphemes and set the distribution of R, C, V based on that.\n\nThanks for sharing Fmix, I didn't know about that, I'll check that out. The image you post does look more natural than CutMix. I used CAM CutMix which also did better than CutMix and looks more natural too.\n\nWhat does \"30 points\" on LB mean?", "775869": "congratulations, I couldn't agree more that `models fitted on graphemes instead of R,C,V separately`, I learned a lesson this time.\n\n", "778609": "What you guys are doing is so different from us computer vision engineers. It seems that people who good at tabular data does think in a different way than the people who are mainly doing CV. I learned a lot from your post. Thanks!", "775761": "Congratulations! Amazing solutions. I want to be an expert like you :)", "776738": "Congrats on the result and the solution!\n\n> As always, we tried to understand how test data can be different, and why there is a gap to local CV.\n\nI need to learn from you on this. I already wrote it, maybe I'll start doing it ;)", "776333": "Congrats! Amazing result, waiting to see the details!", "775973": "Congrats. \nOne silly question, you guys stick with the same team name (The Zoo), what is it about? 😂 ", "775788": "Congrats again The Zoo. The Tom Brady of Kaggle.", "778494": "Fantastic work and congratulations! One question:\n\"So we tried something funny, which is adding additional C=3 and C=6 predictions based on the next highest indices. Just adding 310 C=3 and 310 C=6\" - I don't understand this. Are you upsampling these rare examples? Or, do you say, \"if C=3 or C=6 is the 2nd most confident prediction, hardcode it as c=3 and c=6 instead of using the 1st most confident prediction\". Thank you\n\nAlso, I want to emphasize that it was smart for your team to choose models predicting solely R and solely C. In fact, there was some early talk about making 3 models for each part, which I dismissed because in CHAMPS actually I saw that fitting to the extra auxiliary targets helped the model learn more. I will keep this balance in mind for the future when considering generalization, Congrats you guys are unstoppable!!", "776618": "congrats @philippsinger \nso flattered to learn from kaggle guru like you \ncongrats to all ", "775742": "Congratulations. May I ask what the meaning of 'average the component probabilities of all graphemes' ? ", "775715": "Really want to learn from how you guys can do systematic analysis of the nature of data and applying task-specific approaches. I would say this is a more than reasonable and systematic solution. Congratulations!", "786867": "nice work", "785575": "Congratulations @philippsinger and @dott1718 8, I had a doubt. \n\n> Specifically for C it was very hard to generalize and what helped a bit was to randomly add generated graphemes based on the code we found in this kernel (kudos to the author!) https://www.kaggle.com/kaushal2896/bengali-graphemes-starter-eda-multi-output-cnn\n\nI still didn't get how you generated grapheme using that kernel. My guess is that you used this function:\n\n`def image_from_char(char):\n image = Image.new('RGB', (WIDTH, HEIGHT))\n draw = ImageDraw.Draw(image)\n myfont = ImageFont.truetype('/kaggle/input/kalpurush-fonts/kalpurush-2.ttf', 120)\n w, h = draw.textsize(char, font=myfont)\n draw.text(((WIDTH - w) / 2,(HEIGHT - h) / 3), char, font=myfont)\nreturn image`\n\nBut then, how did you combine R, C, and V to create grapheme? ", "778565": "Congrats ! The post processing idea is really cool. Also, didn't you guys face timeout issues, since we had a 2 hour of limitation on GPU time and you had 7 different models to run?", "778500": "THE ZOO! 💪", "777798": "Congrats! I'm always interested in looking Zoo team's solution. @philippsinger @dott1718 \nYour approach to deeply understanding train/test data to consider the solution is impressive.\n\nHow did you determine blending weight? by local hold-out testing?", "776243": "Congrats. Cant wait to see your details.", "775969": "[question placeholder]\n\nCongratulation!\nCant wait to see your full post!", "775868": "Congrats! So amazing! I think that's the magic they talked about~", "775773": "The dream Zoo 😄", "775757": "The Zoo does it again! Congrats and amazing solution, can't wait to read the full writeup!", "775755": "Congratulations and nice work! I've also averaged the probabilities of all graphemes to deal with unseen but it seems not work for me T.T, look forward to the details!", "775741": "Congrats, thanks for sharing and looking forward to the full writeup! \n\nCan confirm that training on graphemes and using 3 component heads jointly really overfit to seen graphemes... Lesson learned. ", "1297778": "", "775885": "" } }